🔍 Key Observations:
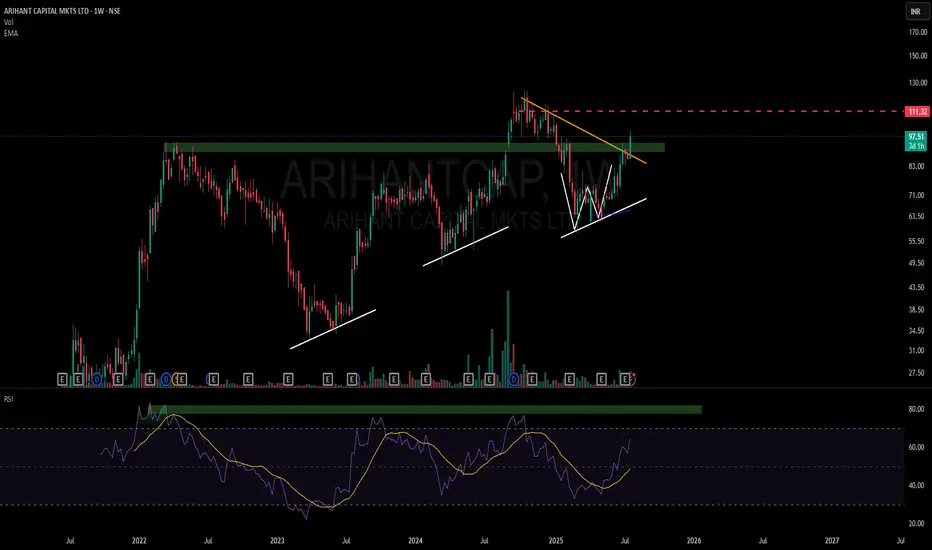
- Supply ➡️ Demand Flip: The green zone previously acted as a supply region but was recently respected as demand, showcasing a classic SD conversion
- Double Bottom + Higher Lows (Structure): A W-bottom has formed on the weekly timeframe (WTF), with rising higher lows (marked in white)
- Weekly RSI Momentum: RSI has broken out of a local resistance, historically sensitive 76-80 band — a region that previously capped upside
📎 Why this matters (Learning Focus):
This chart provides a neat case study on how multiple timeframe resistance (red dotted) and structural clues such as higher lows, SD flips, and clean RSI zones
📘 Remember:
This is not a prediction — it's a framework for thinking. The goal here is to observe price behavior around critical levels, not a call or tip.
🎯 Master My Self-Made Trading Strategy
📈 Telegram (Learn Today): t.me/hashtaghammer
✅ WhatsApp (Learn Today): wa.me/919455664601
📈 Telegram (Learn Today): t.me/hashtaghammer
✅ WhatsApp (Learn Today): wa.me/919455664601
Bài đăng liên quan
Thông báo miễn trừ trách nhiệm
Thông tin và các ấn phẩm này không nhằm mục đích, và không cấu thành, lời khuyên hoặc khuyến nghị về tài chính, đầu tư, giao dịch hay các loại khác do TradingView cung cấp hoặc xác nhận. Đọc thêm tại Điều khoản Sử dụng.