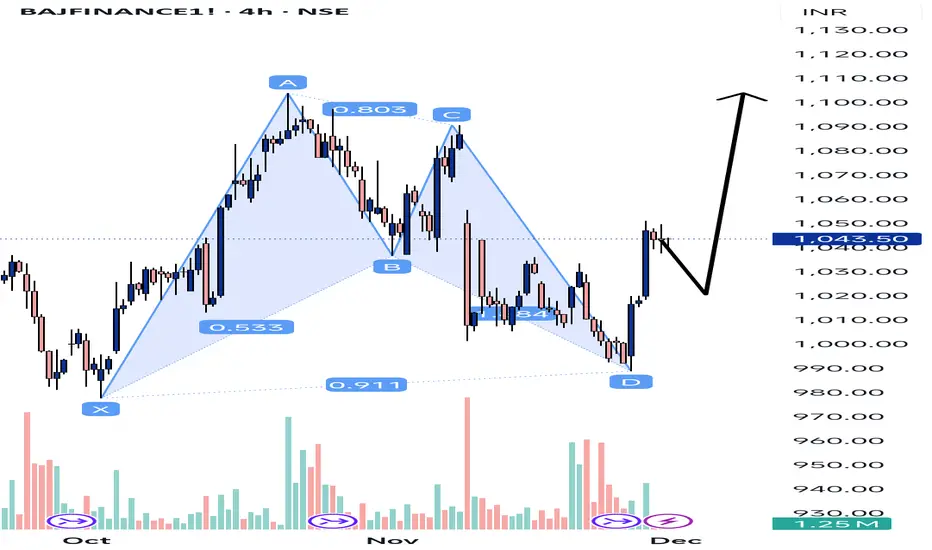
The shaded blue structure with points X – A – B – C – D is a harmonic pattern (looks like a bullish Gartley / Bat-type pattern):
X → A → B → C → D marks swings in price.
The little numbers like 0.803, 0.533, 0.911 are Fibonacci ratios used to validate the harmonic pattern.
Point D is at the bottom right – that’s usually the potential reversal zone (PRZ) where price is expected to stop falling and start moving up.
So:
👉 The pattern is suggesting bullish reversal from D (buyers stepping in around the lows near ₹990–1,000 area).
---
Current price action
After hitting D, price has bounced up and is now near ₹1,040+.
The candles from D to current level show recovery, confirming that the pattern’s reversal is (so far) working.
Thông báo miễn trừ trách nhiệm
Thông tin và các ấn phẩm này không nhằm mục đích, và không cấu thành, lời khuyên hoặc khuyến nghị về tài chính, đầu tư, giao dịch hay các loại khác do TradingView cung cấp hoặc xác nhận. Đọc thêm tại Điều khoản Sử dụng.
Thông báo miễn trừ trách nhiệm
Thông tin và các ấn phẩm này không nhằm mục đích, và không cấu thành, lời khuyên hoặc khuyến nghị về tài chính, đầu tư, giao dịch hay các loại khác do TradingView cung cấp hoặc xác nhận. Đọc thêm tại Điều khoản Sử dụng.