1️⃣ Pattern & Structure
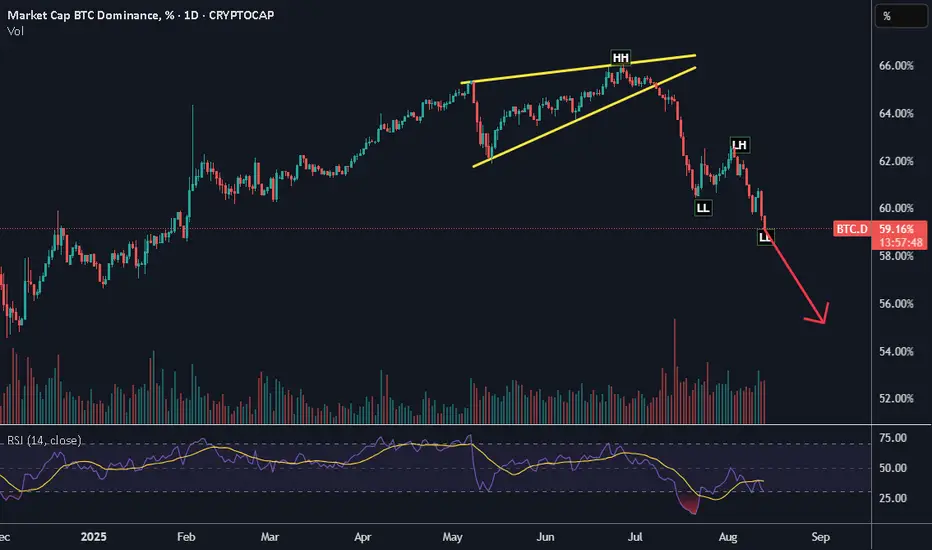
We had a rising wedge formation earlier (yellow trend lines) — a bearish pattern.
The breakout happened to the downside, confirming bearish bias.
The chart is now printing Lower Highs (LH) and Lower Lows (LL) — a clear downtrend.
2️⃣ Current Situation
BTC dominance has just broken the 59% support level, which was a key horizontal support.
RSI is still low (around 38), meaning momentum is bearish but not yet extremely oversold — more downside possible.
Volume spikes during down moves show strong selling pressure.
3️⃣ Projection
Based on the technicals, BTC dominance could head towards the 56%–54% range (next major support).
This usually means altcoins may outperform Bitcoin in the coming sessions (alt season signs).
4️⃣ Trading Implication
If BTC dominance keeps dropping, money may rotate into ETH, SOL, other altcoins.
Watch for BTC dominance bounce near 56% — that could slow altcoin rally.
Thông báo miễn trừ trách nhiệm
Thông tin và các ấn phẩm này không nhằm mục đích, và không cấu thành, lời khuyên hoặc khuyến nghị về tài chính, đầu tư, giao dịch hay các loại khác do TradingView cung cấp hoặc xác nhận. Đọc thêm tại Điều khoản Sử dụng.
Thông báo miễn trừ trách nhiệm
Thông tin và các ấn phẩm này không nhằm mục đích, và không cấu thành, lời khuyên hoặc khuyến nghị về tài chính, đầu tư, giao dịch hay các loại khác do TradingView cung cấp hoặc xác nhận. Đọc thêm tại Điều khoản Sử dụng.