Bitcoin CME futures are forming a technical pattern that points to a period of consolidation before a potential upward surge, provided that key support levels remain intact.
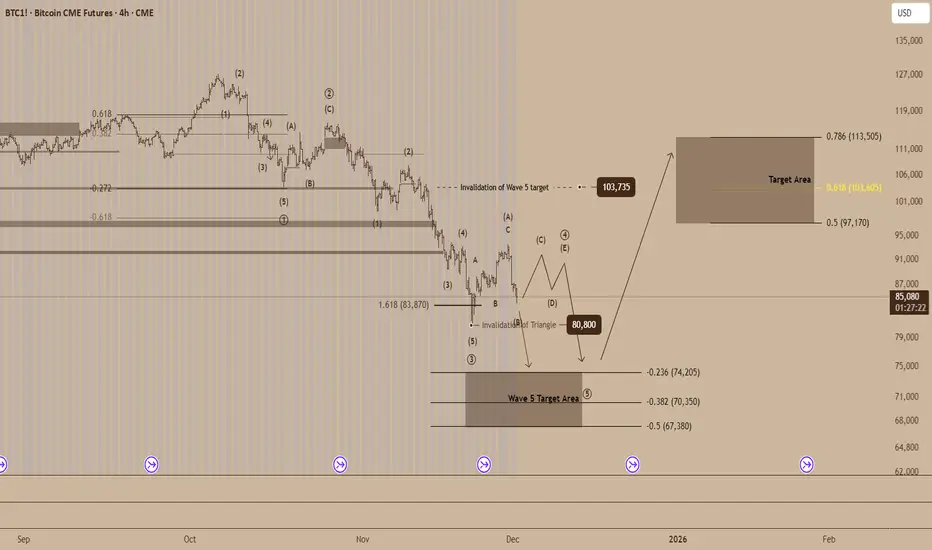
Recent price action indicates the development of a Wave 4 triangle, a structure that often appears when markets pause before continuing their primary trend. The lower boundary of this formation sits near $80,800, which serves as a pivotal support level. A decisive drop below this threshold would disrupt the triangle scenario and suggest that the market may be preparing for a deeper pullback.
The decline into the $83,870 region aligns with the 1.618 Fibonacci extension, a level commonly associated with Wave 3 completion. The subsequent movements from this area resemble an A B C corrective bounce, reinforcing the idea that the market is testing the early stages of a compressing triangle.
If this pattern continues to mature, traders may observe a series of contracting swings labeled C, D and E. A breakout from the final swing would serve as confirmation that the larger bullish trend is resuming. The broader Wave 5 outlook has an invalidation level near $103,735, and a sustained move above this region would signal renewed momentum.
The projected Wave 5 target area spans $97,170 to $113,505, corresponding to the 0.5 to 0.786 Fibonacci retracements. Within this range, the 0.618 level at $103,605 stands out as a key price marker that may attract significant interest if bullish pressure returns.
Conversely, if support at $80,800 fails to hold, attention would shift to the deeper Wave 5 target zone between $74,205 and $67,380, marked by the negative 0.236 to negative 0.5 Fibonacci extensions.
For now, Bitcoin appears to be balancing between consolidation and continuation. Whether this evolving structure resolves higher or signals a larger corrective phase will likely set the tone for the next major move in the futures market.
Thông báo miễn trừ trách nhiệm
Thông tin và các ấn phẩm này không nhằm mục đích, và không cấu thành, lời khuyên hoặc khuyến nghị về tài chính, đầu tư, giao dịch hay các loại khác do TradingView cung cấp hoặc xác nhận. Đọc thêm tại Điều khoản Sử dụng.
Thông báo miễn trừ trách nhiệm
Thông tin và các ấn phẩm này không nhằm mục đích, và không cấu thành, lời khuyên hoặc khuyến nghị về tài chính, đầu tư, giao dịch hay các loại khác do TradingView cung cấp hoặc xác nhận. Đọc thêm tại Điều khoản Sử dụng.