Bitcoin (BTC) – Weekly Technical Overview
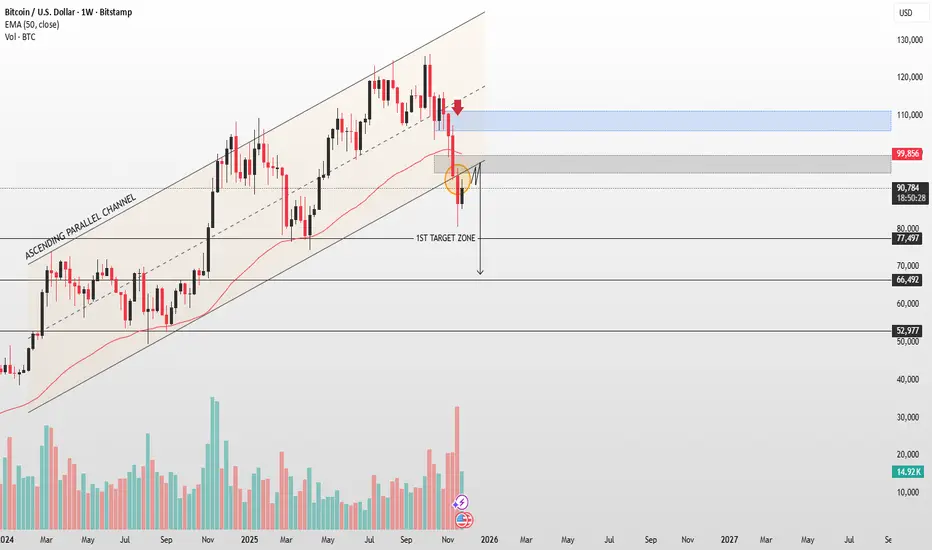
BTC has broken down from its long-standing ascending parallel channel, confirming a shift in trend momentum. Price rejected strongly from the key resistance zone near $110K, followed by an impulsive drop below the 50-week EMA, which is now acting as dynamic resistance.
Current weekly structure shows a relief bounce toward the previous support-turned-resistance zone ($95K–$100K). Failure to reclaim this level keeps downside pressure intact. A lower-high formation in this area would reinforce bearish continuation.
The chart highlights a first target zone around $77K–$80K, aligned with major horizontal support. A deeper extension remains possible toward the next structural demand region near $66K and ultimately $53K, if selling accelerates.
Overall sentiment remains bearish while below the EMA and broken channel support. Bulls need a decisive weekly close back above $100K to regain control.
Giao dịch đang hoạt động
Smart trades begin with smart signals. Join us
t.me/NabeelaFatima
Gold, Forex & Crypto
Your edge starts here
t.me/NabeelaFatima
t.me/NabeelaFatima
Gold, Forex & Crypto
Your edge starts here
t.me/NabeelaFatima
Thông báo miễn trừ trách nhiệm
Thông tin và các ấn phẩm này không nhằm mục đích, và không cấu thành, lời khuyên hoặc khuyến nghị về tài chính, đầu tư, giao dịch hay các loại khác do TradingView cung cấp hoặc xác nhận. Đọc thêm tại Điều khoản Sử dụng.