📊 DABUR: Comprehensive Multi-Timeframe Demand-Supply Analysis
🎯 Executive Summary
This detailed analysis examines Dabur's price action across multiple timeframes using advanced demand-supply methodology. The stock demonstrates strong bullish momentum with multiple coinciding demand zones across higher timeframes, signaling potential for significant upward movement.
📅 Monthly Timeframe Analysis
Key Observations:
Strong Demand Zone Activation 💪
The monthly timeframe reveals that price has successfully picked up pending orders from a 1-month demand zone, triggering a powerful upward move. This demand zone represents institutional buying interest and forms the foundation of the current bullish structure.
Fresh Demand Zone Formation 📈
Following the initial order pickup, price has created a new 2 base candle monthly demand zone. The formation of fresh demand zones after respecting previous ones is a critical bullish signal that confirms:

Current Month Response ✅
The current month's candle has reacted positively from this newly formed 2-base candle monthly demand zone, printing a green candle. This back-to-back demand zone respect pattern strongly suggests:
📊 Weekly Timeframe Analysis
Demand Zone Respect Pattern:
Consistent Zone Validation 🔄
The weekly timeframe mirrors the monthly bullish structure, with demand zones being consistently respected and price delivering upward moves from each zone. This repeated pattern across multiple weeks confirms the strength of the underlying demand.
Fresh Weekly Demand Zone 🆕
Currently, price is approaching a fresh weekly demand zone that has not been tested yet. Key characteristics:
Back-to-Back Zone Formation 🏗️
The continuous formation of back-to-back demand zones, combined with price respecting and reacting from each zone with upward moves, clearly indicates:
📉 Daily Timeframe Analysis
Critical Confluence Zone:
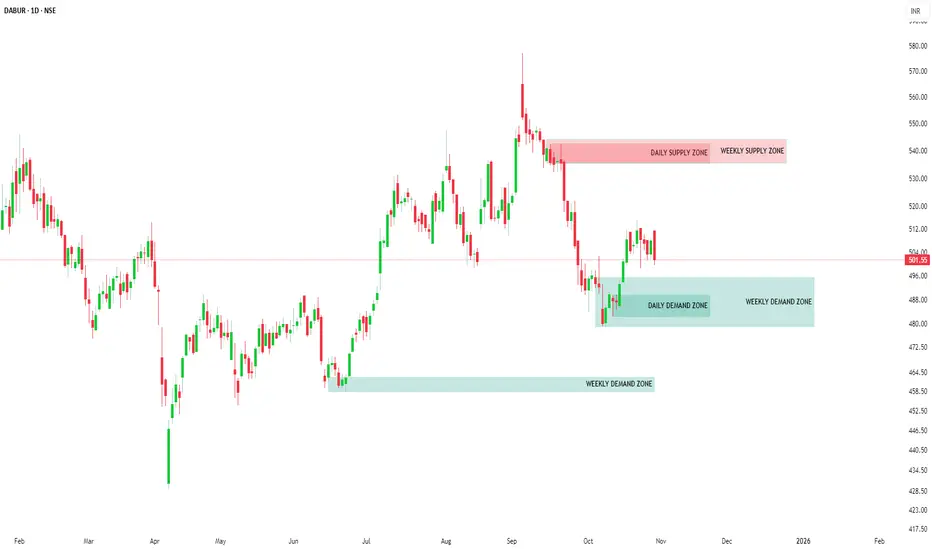
Weekly-Daily Demand Zone Alignment 🎪
The daily timeframe shows price currently approaching a demand zone that coincides with the weekly demand zone. This creates a powerful confluence level with enhanced significance because:
Probability Assessment:
Bullish Factors ✨
✅ Back-to-back demand zone formation
✅ Consistent demand zone respect across timeframes
✅ Fresh weekly demand zone approaching
✅ Daily-Weekly demand zone coincidence
✅ Green candle formation on monthly chart
✅ Clear uptrend structure establishment
Expected Outcome 🚀
Based on the multi-timeframe demand-supply structure, Dabur is positioned for a substantial upward move. The alignment of demand zones across monthly, weekly, and daily timeframes, combined with consistent price respect and fresh zone formation, creates an exceptionally strong bullish setup with high probability of success.
📌 Conclusion
The demand-supply analysis across multiple timeframes reveals that Dabur has established a robust bullish structure with buyer dominance clearly visible. The coincidence of demand zones, back-to-back zone formation, and consistent price respect create a compelling case for significant upside potential.
⚠️ IMPORTANT DISCLAIMER
Regulatory Compliance Notice
SEBI Compliance Statement:
In strict adherence to the latest Securities and Exchange Board of India (SEBI) guidelines, this content is NOT a trading recommendation, investment advice, or educational material. This publication serves informational purposes only.
Professional Disclaimer
Registration Status:
I am NOT a SEBI Registered Research Analyst (RA) nor a SEBI Registered Investment Adviser (RIA). This analysis does not constitute professional financial advice or recommendations as defined under SEBI regulations.
Risk Disclosure
Investment Advisory:
This analysis is provided solely for informational and reference purposes. Readers are strongly advised to:
Liability Limitation:
The author assumes no responsibility for any financial losses, damages, or consequences arising from the use or interpretation of this information. All investment decisions remain the sole responsibility of the individual investor.
Market Risk:
Past performance and technical analysis do not guarantee future results. Markets are subject to inherent risks, volatility, and unpredictable factors.
🎯 Executive Summary
This detailed analysis examines Dabur's price action across multiple timeframes using advanced demand-supply methodology. The stock demonstrates strong bullish momentum with multiple coinciding demand zones across higher timeframes, signaling potential for significant upward movement.
📅 Monthly Timeframe Analysis
Key Observations:
Strong Demand Zone Activation 💪
The monthly timeframe reveals that price has successfully picked up pending orders from a 1-month demand zone, triggering a powerful upward move. This demand zone represents institutional buying interest and forms the foundation of the current bullish structure.
Fresh Demand Zone Formation 📈
Following the initial order pickup, price has created a new 2 base candle monthly demand zone. The formation of fresh demand zones after respecting previous ones is a critical bullish signal that confirms:
- Buyers maintain control of the stock
- Momentum is building for continuation
- The uptrend structure is solidifying
Current Month Response ✅
The current month's candle has reacted positively from this newly formed 2-base candle monthly demand zone, printing a green candle. This back-to-back demand zone respect pattern strongly suggests:
- The stock has entered a confirmed uptrend
- Price is preparing for a substantial upside move
- Buyer dominance is firmly established
📊 Weekly Timeframe Analysis
Demand Zone Respect Pattern:
Consistent Zone Validation 🔄
The weekly timeframe mirrors the monthly bullish structure, with demand zones being consistently respected and price delivering upward moves from each zone. This repeated pattern across multiple weeks confirms the strength of the underlying demand.
Fresh Weekly Demand Zone 🆕
Currently, price is approaching a fresh weekly demand zone that has not been tested yet. Key characteristics:
- Untested zones typically produce stronger reactions
- Expected significant upward move from this level
- High probability of continuation to higher levels
Back-to-Back Zone Formation 🏗️
The continuous formation of back-to-back demand zones, combined with price respecting and reacting from each zone with upward moves, clearly indicates:
- Stock is preparing for a major upward leg
- Accumulation phase is progressing systematically
- Each pullback is being used for additional buying
📉 Daily Timeframe Analysis
Critical Confluence Zone:
Weekly-Daily Demand Zone Alignment 🎪
The daily timeframe shows price currently approaching a demand zone that coincides with the weekly demand zone. This creates a powerful confluence level with enhanced significance because:
- Higher timeframe price structure taking precedence
- Increased institutional interest at these levels
- Multiple timeframe participants converging at the same price level
- Maximum probability of reversal and upward continuation
Probability Assessment:
Bullish Factors ✨
✅ Back-to-back demand zone formation
✅ Consistent demand zone respect across timeframes
✅ Fresh weekly demand zone approaching
✅ Daily-Weekly demand zone coincidence
✅ Green candle formation on monthly chart
✅ Clear uptrend structure establishment
Expected Outcome 🚀
Based on the multi-timeframe demand-supply structure, Dabur is positioned for a substantial upward move. The alignment of demand zones across monthly, weekly, and daily timeframes, combined with consistent price respect and fresh zone formation, creates an exceptionally strong bullish setup with high probability of success.
📌 Conclusion
The demand-supply analysis across multiple timeframes reveals that Dabur has established a robust bullish structure with buyer dominance clearly visible. The coincidence of demand zones, back-to-back zone formation, and consistent price respect create a compelling case for significant upside potential.
⚠️ IMPORTANT DISCLAIMER
Regulatory Compliance Notice
SEBI Compliance Statement:
In strict adherence to the latest Securities and Exchange Board of India (SEBI) guidelines, this content is NOT a trading recommendation, investment advice, or educational material. This publication serves informational purposes only.
Professional Disclaimer
Registration Status:
I am NOT a SEBI Registered Research Analyst (RA) nor a SEBI Registered Investment Adviser (RIA). This analysis does not constitute professional financial advice or recommendations as defined under SEBI regulations.
Risk Disclosure
Investment Advisory:
This analysis is provided solely for informational and reference purposes. Readers are strongly advised to:
- Consult a SEBI-registered financial advisor or investment professional
- Conduct comprehensive independent research
- Perform thorough due diligence before making any investment decisions
- Assess their own risk tolerance and financial situation
Liability Limitation:
The author assumes no responsibility for any financial losses, damages, or consequences arising from the use or interpretation of this information. All investment decisions remain the sole responsibility of the individual investor.
Market Risk:
Past performance and technical analysis do not guarantee future results. Markets are subject to inherent risks, volatility, and unpredictable factors.
Ghi chú
After the price entered the zone 📈, a 3:1 risk-reward ratio 🎯 was achieved in just one day following entry ⚡.The alignment of demand zones 🔵, consecutive zone formations 📊, and consistent price respect ✅ creates a strong case for significant upside potential 🚀 and delivers spectacular results 💰 within one day of entry 🔥.
🔄 Demand Supply Zones Indicator
🎯 MTF Analysis | 💎 Auto Zone Detection | 🚀 Auto Stocks Zone Scanner
More Details On : supplydemandzonespro.odoo.com/
Join us on Telegram : t.me/SUPPLY_DEMAND_ZONES_PRO
🎯 MTF Analysis | 💎 Auto Zone Detection | 🚀 Auto Stocks Zone Scanner
More Details On : supplydemandzonespro.odoo.com/
Join us on Telegram : t.me/SUPPLY_DEMAND_ZONES_PRO
Thông báo miễn trừ trách nhiệm
Thông tin và các ấn phẩm này không nhằm mục đích, và không cấu thành, lời khuyên hoặc khuyến nghị về tài chính, đầu tư, giao dịch hay các loại khác do TradingView cung cấp hoặc xác nhận. Đọc thêm tại Điều khoản Sử dụng.