ETH/USDT — Technical Analysis (1D Chart)
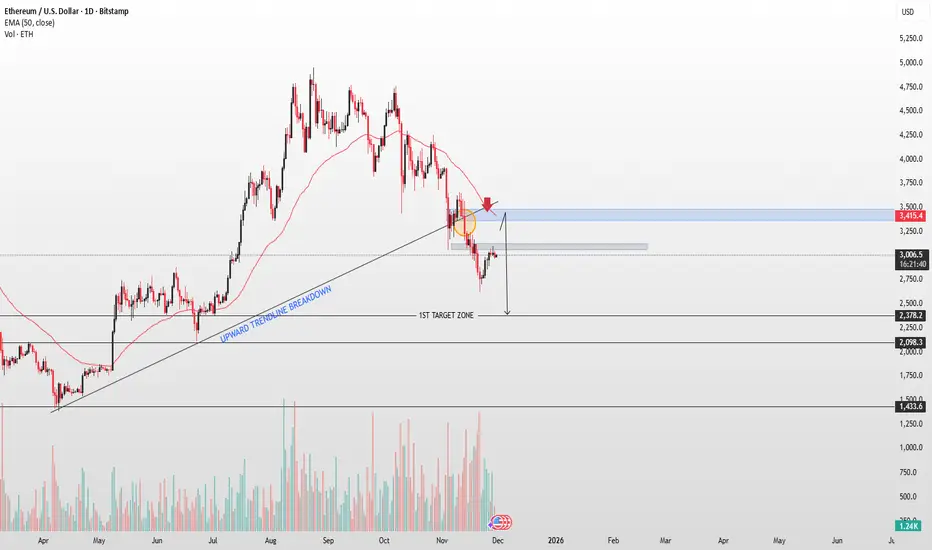
ETH is trading around $3,000 after breaking below its long-term upward trendline, showing a shift in market structure. Price attempted a retest of the broken trendline and the 50-day EMA ($3,415) but failed to reclaim it, forming rejection wicks in the highlighted zone a classic bearish retest.
Key Notes:
Structure: Lower highs and lower lows confirm a bearish continuation.
EMA: Price is trading below the 50-EMA, reinforcing downside pressure.
Resistance Zone: $3,250–$3,450 remains strong supply.
Immediate Bias: Bearish unless price closes above $3,450.
Downside Targets:
$2,750–$2,800 First demand area (marked 1st target zone)
$2,378 Major support
$2,098 Next swing-low support
A short-term relief bounce is possible, but the larger trend favours continuation lower unless ETH regains the broken trendline and EMA with conviction.
Smart trades begin with smart signals. Join us
t.me/NabeelaFatima
Gold, Forex & Crypto
Your edge starts here
t.me/NabeelaFatima
t.me/NabeelaFatima
Gold, Forex & Crypto
Your edge starts here
t.me/NabeelaFatima
Bài đăng liên quan
Thông báo miễn trừ trách nhiệm
Thông tin và các ấn phẩm này không nhằm mục đích, và không cấu thành, lời khuyên hoặc khuyến nghị về tài chính, đầu tư, giao dịch hay các loại khác do TradingView cung cấp hoặc xác nhận. Đọc thêm tại Điều khoản Sử dụng.