📉 Market Structure
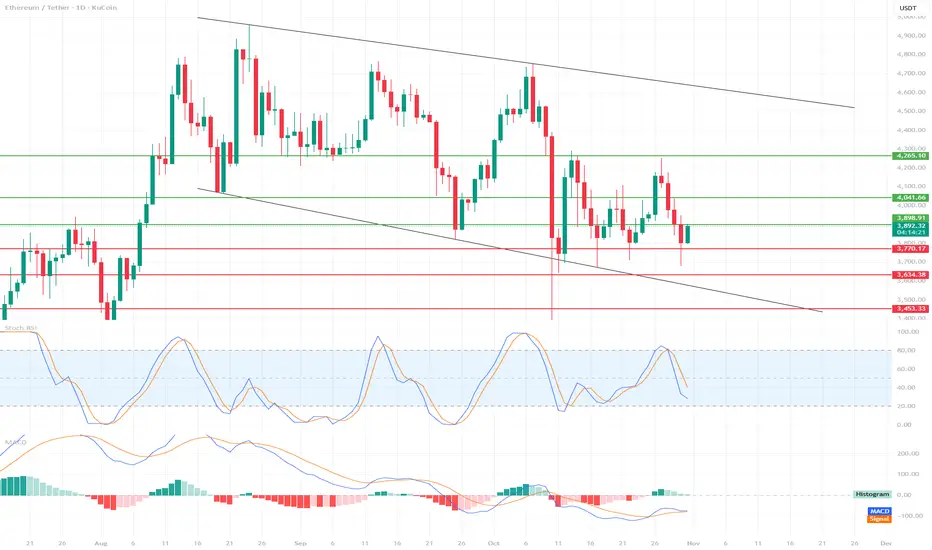
We see a descending channel, bounded by two black trend lines.
Upper Boundary: ~$4,700
Lower Boundary: currently around $3,700, representing strong dynamic support.
The price is currently hovering slightly above the lower edge of the channel, suggesting a possible rebound, but the market remains in a medium-term downtrend.
🔍 Support and Resistance Levels
Support:
$3,770 → currently being tested, crucial in the short term.
$3,643 → next strong support from previous lows.
$3,453 → last line of defense against a steeper decline.
Resistance:
$3,889 → closest resistance, current local ceiling.
$4,041 → strong resistance resulting from prior consolidation.
USD 4.265 → a line that, if broken, could signal a change in the medium-term trend.
📊 Technical Indicators
Stochastic RSI
Located near the oversold zone (below 20), with a slight upward curve.
🔹 Signal: Potential upside move (bounce) in the short term if the %K and %D lines cross upward.
MACD
The MACD line is slightly below zero, but is starting to curve upward and may soon cross the signal line.
🔹 The histogram is starting to decline on the negative side – this is often an early bullish signal (possible change in momentum).
⚖️ Scenarios
🔹 Bullish
If ETH holds above USD 3,770 and the Stoch RSI confirms the rebound, a possible move towards:
3,889 → USD 4,041 → USD 4,265.
A break above USD 4,265 could open the way to USD 4,500+ (upper band of the channel).
🔻 Bearish
Loss of support at USD 3,770 → a signal of weakness.
Then the next downside targets:
USD 3,643, then USD 3,453.
If USD 3,453 breaks, possible tests of the lower band of the channel – even around USD 3,300.
🧭 Summary
Main trend: downward (descending channel).
Short-term bias: neutral-bullish (potential for a rebound from support).
Key level to watch: USD 3,770 – maintaining this level could trigger a rebound, loss = risk of a steeper decline.
Thông báo miễn trừ trách nhiệm
Thông tin và ấn phẩm không có nghĩa là và không cấu thành, tài chính, đầu tư, kinh doanh, hoặc các loại lời khuyên hoặc khuyến nghị khác được cung cấp hoặc xác nhận bởi TradingView. Đọc thêm trong Điều khoản sử dụng.
Thông báo miễn trừ trách nhiệm
Thông tin và ấn phẩm không có nghĩa là và không cấu thành, tài chính, đầu tư, kinh doanh, hoặc các loại lời khuyên hoặc khuyến nghị khác được cung cấp hoặc xác nhận bởi TradingView. Đọc thêm trong Điều khoản sử dụng.