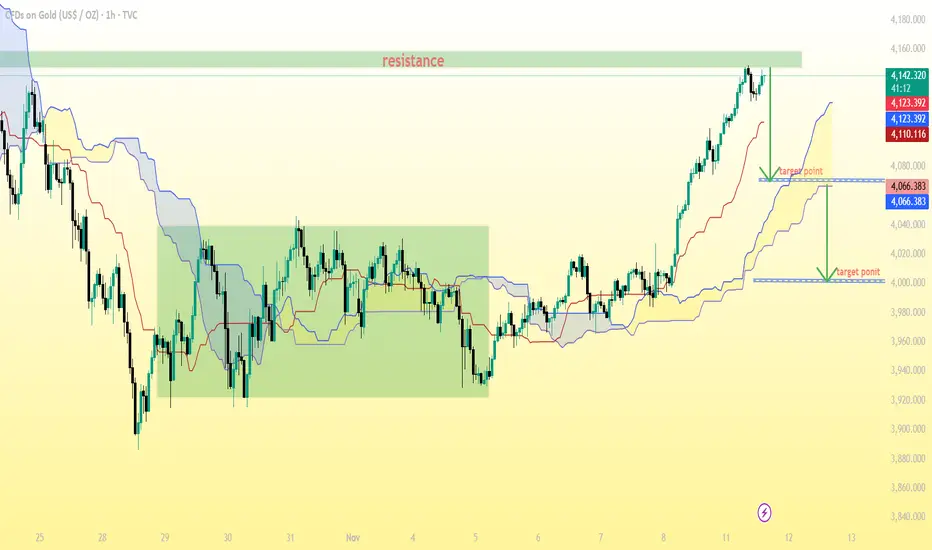
GOLD (XAU/USD) 1-hour chart with Ichimoku Cloud, and my marked resistance and two target points.
Here’s the analysis based on what’s visible:
Current price: Around $4,141 (based on my chart labels).
Resistance zone: Around $4,140 – $4,150, which is where price is currently testing.
Upper target point (minor correction target): Around $4,123 – $4,125.
Lower target point (major correction target): Around $4,066 – $4,070.
📊 Interpretation:
If price fails to break resistance (4,150) and forms rejection candles, it could retrace toward:
Target 1: $4,123 (short-term support)
Target 2: $4,066 (cloud base and major support zone)
If price breaks and holds above 4,150, then the bullish trend can extend further upward, possibly toward $4,180–$4,200.
Giao dịch đang hoạt động
active Bài đăng liên quan
Thông báo miễn trừ trách nhiệm
Thông tin và các ấn phẩm này không nhằm mục đích, và không cấu thành, lời khuyên hoặc khuyến nghị về tài chính, đầu tư, giao dịch hay các loại khác do TradingView cung cấp hoặc xác nhận. Đọc thêm tại Điều khoản Sử dụng.
Bài đăng liên quan
Thông báo miễn trừ trách nhiệm
Thông tin và các ấn phẩm này không nhằm mục đích, và không cấu thành, lời khuyên hoặc khuyến nghị về tài chính, đầu tư, giao dịch hay các loại khác do TradingView cung cấp hoặc xác nhận. Đọc thêm tại Điều khoản Sử dụng.