On Balance Volume (OBV) plus CMF divergences
On Balance Volume (O.B.V.)
1. Introduction
2. Definition
3. Example
4. Conclusion
1. Introduction
The On Balance Volume indicator (O.B.V.) is used in technical analysis to measure buying and selling pressure. It is a cumulative indicator meaning that on days where price went up, that day's volume is added to the cumulative O.B.V. total. If price went down, then that day's volume is subtracted from the O.B.V. total. The O.B.V. value is then plotted as a line for easy interpretation. On Balance Volume is primarily used to confirm or identify overall price trends or to anticipate price movements after divergences. The basic theory behind the On Balance Volume indicator is that volume precedes price. This is important because it allows the O.B.V. to be used for a couple of different purposes. It can be used for general trend identification or confirmation. It can also be used to anticipate price movement after divergences.
It is important to keep in mind that the O.B.V. measures volume levels in relation to the price. I highly recommend using the Chaikin Money Flow (C.M.F.) in tandem with the O.B.V since the O.B.V. will not always give you a clear divergence. See:

2. Definition
If the closing price is above the prior close price then:
Current O.B.V. = Previous O.B.V. + Current Volume
If the closing price is below the prior close price then:
Current O.B.V. = Previous O.B.V. - Current Volume
If the closing prices equals the prior close price then:
Current O.B.V. = Previous O.B.V. (no change)
Resources quoted: www.tradingview.com/...i/On_Balance_Volume_(OBV)
Now for the important part...
3. Example
1. Introduction
2. Definition
3. Example
4. Conclusion
1. Introduction
The On Balance Volume indicator (O.B.V.) is used in technical analysis to measure buying and selling pressure. It is a cumulative indicator meaning that on days where price went up, that day's volume is added to the cumulative O.B.V. total. If price went down, then that day's volume is subtracted from the O.B.V. total. The O.B.V. value is then plotted as a line for easy interpretation. On Balance Volume is primarily used to confirm or identify overall price trends or to anticipate price movements after divergences. The basic theory behind the On Balance Volume indicator is that volume precedes price. This is important because it allows the O.B.V. to be used for a couple of different purposes. It can be used for general trend identification or confirmation. It can also be used to anticipate price movement after divergences.
It is important to keep in mind that the O.B.V. measures volume levels in relation to the price. I highly recommend using the Chaikin Money Flow (C.M.F.) in tandem with the O.B.V since the O.B.V. will not always give you a clear divergence. See:
2. Definition
If the closing price is above the prior close price then:
Current O.B.V. = Previous O.B.V. + Current Volume
If the closing price is below the prior close price then:
Current O.B.V. = Previous O.B.V. - Current Volume
If the closing prices equals the prior close price then:
Current O.B.V. = Previous O.B.V. (no change)
Resources quoted: www.tradingview.com/...i/On_Balance_Volume_(OBV)
Now for the important part...
3. Example
- As seen on the top chart labeled as Divergence #1 (LTC on the daily), the O.B.V rose in tandem with the price action. What does not show is the bearish divergence on the C.M.F. Buy pressure does not always show accurately on the O.B.V. due to the way it calculates the inputs (which is why I recommend using the C.M.F. with it). As price rose, the C.M.F. gave us a very clear bearish divergence that would of allowed you to exit out of a position and flip.
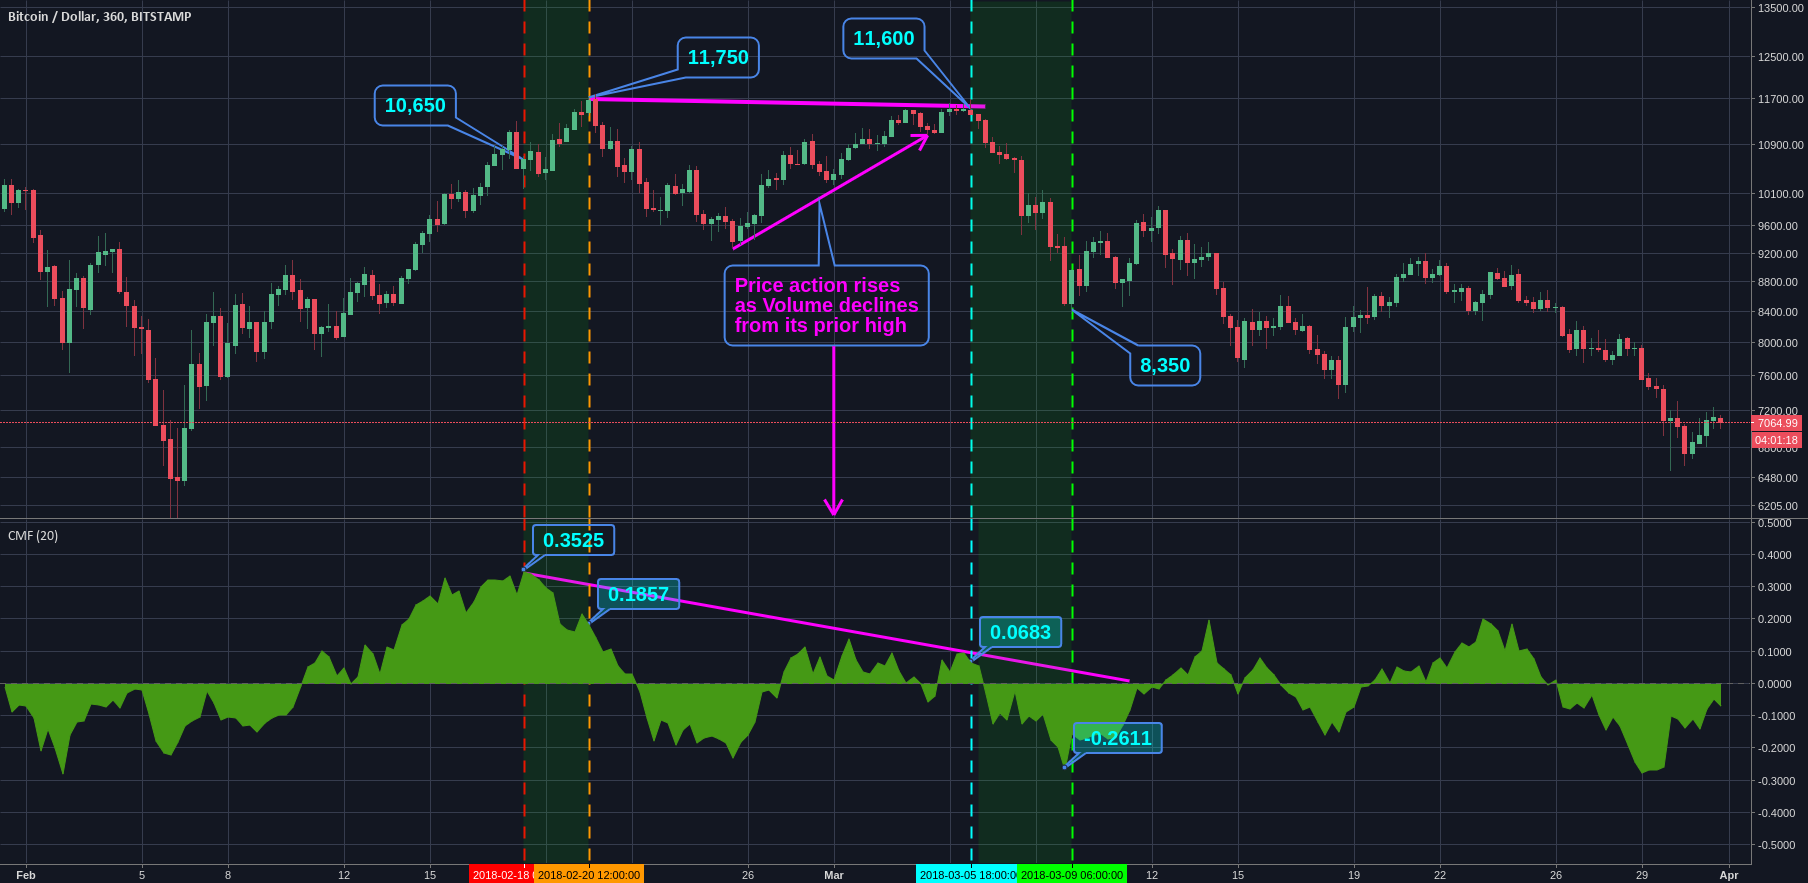
- As can be seen in Divergence #2, we re-tested the past resistance with less than convincing volume on the O.B.V. & the C.M.F.. Bulls went at it again 11 days later in the same divergence and ultimately failed due to lack of volume/buy pressure. Once again, this set up a perfect short position. If you were to trade this, you would continue to add to your short during that 13 day period and closely monitor these two indicators for a break into positive buy pressure that would pull it out of its divergence. This rarely happens, but TradingView allows you to set alarms on indicators and you would then exit out of your short position at a small loss. In this example, we also see a nice bearish divergence in relation to the prior rally labeled divergence #1.
- Divergence #3 shows a beautiful bullish divergence. Price action dropped as volume and buy pressure picked up on the O.B.V. & the C.M.F.. If you were to trade this cautiously, based on those two indicators, you would enter into the long position at the end of the yellow box where a breakout occurred and was confirmed by the rise in volume. An aggressive and risky trader would have bought the oversold candle. However, nothing showing here gave you an indication that was the bottom other than the slight bounce on what could be called an O.B.V. support line in yellow.
Bình luận:
Also please check out www.youtube.com/watch?v=1BnjhXPZ... for additional explanations.
Bình luận:
All posts are for educational purposes and are simply my views of markets conditions.
Please do your own research and use my content to educate yourself.
Please do your own research and use my content to educate yourself.
If you were paying attention to this above when we had that giant run up with Bitcoin, you would have been able to spot the beginning of the top.
Shown here on the BTC hourly the O.B.V. showed a peak when Bitcoin's price was at $17,100. We then began to re-test the same resistance level a few days later with lower volume. However, the lack of sellers allowed BTC to breakout creating a new all time high. Trading this, you would have done with extreme caution, as any short position would be in jeopardy due to the price breakout. This was still a very good indication of the dying bull pressure and something you would definitely use to help predict the top. This would've saved a lot of top buyers.
Shown here on the same chart is the C.M.F. bearish divergence.
4. Conclusion
I believe that buying and selling pressure precede changes in price. Volume can be used a number of ways including confirming price trends, price reversals, and price breakouts. I strongly recommend you use volume indicators in tandem with momentum and strength indicators.
I will be moving on from volume indicators for a bit, as I have now covered what I think are the two most useful volume indicators. I will focus on risk management and other indicators for the time being.
Click follow on my profile & ‘Like’ this if you would like to learn about arming yourself with more trading tools. Thanks!