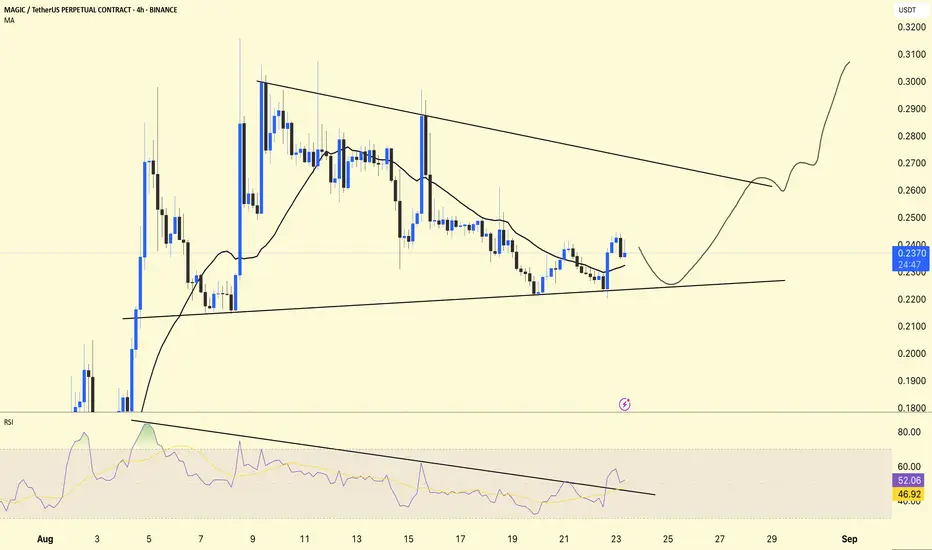
MAGIC is currently trading at $0.2376, showing a falling wedge structure with RSI breakout confirmation.
📊 Chart Overview:
Falling Wedge Pattern
The price is consolidating between a lower high and a higher low.
If it breaks to the upside, it is a bullish reversal pattern.
Support Area
Strong support (trendline support) near $0.22–0.225.
As long as this level holds, downside looks limited.
RSI Indicator
RSI = 52.64, above its MA (46.96).
RSI broke its downtrend line → early sign of bullish momentum building.
Moving Average (MA 25)
The price is slightly above the moving average (0.2324), which is a sign of short-term correction.
DYOR | NFA
Bài đăng liên quan
Thông báo miễn trừ trách nhiệm
Thông tin và các ấn phẩm này không nhằm mục đích, và không cấu thành, lời khuyên hoặc khuyến nghị về tài chính, đầu tư, giao dịch hay các loại khác do TradingView cung cấp hoặc xác nhận. Đọc thêm tại Điều khoản Sử dụng.
Bài đăng liên quan
Thông báo miễn trừ trách nhiệm
Thông tin và các ấn phẩm này không nhằm mục đích, và không cấu thành, lời khuyên hoặc khuyến nghị về tài chính, đầu tư, giao dịch hay các loại khác do TradingView cung cấp hoặc xác nhận. Đọc thêm tại Điều khoản Sử dụng.