📊 NIFTY TRADING PLAN — 10 NOV 2025
(Timeframe Reference: 15-Min Chart)
Chart Summary:
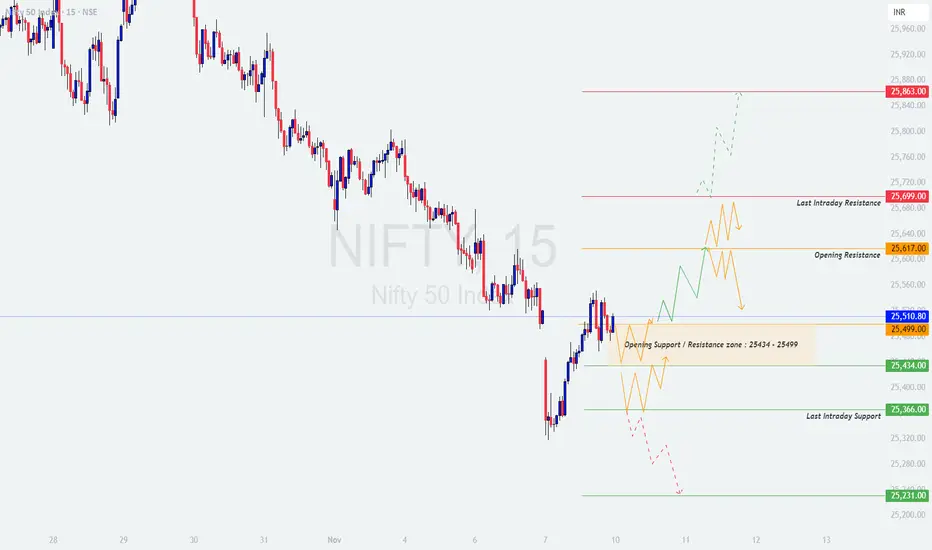
Nifty is currently trading around the 25,510 zone, situated right near the Opening Support / Resistance Zone (25,434 – 25,499). The market structure shows a short-term base building, with the index now oscillating between 25,434 on the downside and 25,617 on the upside. A breakout beyond either level could define the trend for the session.
Key levels to watch include:
🟢 Resistance Zones: 25,617 (Opening Resistance), 25,699 (Last Intraday Resistance), 25,863 (Next Upside Level)
🔴 Support Zones: 25,434 (Immediate), 25,366 (Last Intraday Support), 25,231 (Final Support)
With volatility expected due to global cues and options expiry positioning, traders should emphasize patience, discipline, and confirmation before entry.
🟢 Scenario 1: GAP-UP Opening (100+ Points)
If Nifty opens near or above 25,610 – 25,640, it will directly test the Opening Resistance zone. Bulls need to sustain above this level to maintain control.
💡 Educational Note:
A gap-up does not guarantee continuation. Many traders get trapped in "breakout euphoria" without waiting for confirmation. The key is sustained price action with strong volume. Smart traders often buy on dips after confirmation, not at the peak of the first candle.
🟧 Scenario 2: FLAT Opening (Within 25,434 – 25,499 Zone)
A flat opening inside the Opening Support / Resistance Zone will likely cause initial indecision. The market may first trap both sides before picking direction.
🧠 Educational Tip:
Flat openings test patience — they’re designed to frustrate impulsive traders. Remember: The first move after a flat open is often false. Wait for clear direction confirmed by price structure and volume alignment before taking a stance.
🔴 Scenario 3: GAP-DOWN Opening (100+ Points)
If Nifty opens below 25,410 or near 25,366, sentiment may turn weak initially, bringing the Last Intraday Support (25,366 – 25,231) into focus.
📘 Educational Insight:
Gap-downs tend to trigger fear-based selling early in the session. The best approach is to observe — not react — in the first few minutes. If buyers start stepping in near strong support levels, that’s often where reversals begin. Let price tell you its story before taking sides.
💼 RISK MANAGEMENT TIPS FOR OPTIONS TRADERS:
📈 SUMMARY:
📚 CONCLUSION:
Nifty is currently at a pivotal range, consolidating before its next major breakout. The 25,434 – 25,499 zone is the short-term decision point. A break above 25,499 can reignite bullish sentiment, while a fall below 25,434 may extend weakness toward 25,366 or even 25,231.
Be patient during the opening volatility and focus on clarity over speed. The first 15–30 minutes often decide the day’s fate — don’t rush into uncertain setups.
📊 Consistency in following your plan is more powerful than chasing every move.
⚠️ DISCLAIMER:
I am not a SEBI-registered analyst. The views and levels shared are for educational purposes only. Please do your own research or consult a registered financial advisor before making any trading or investment decisions.
(Timeframe Reference: 15-Min Chart)
Chart Summary:
Nifty is currently trading around the 25,510 zone, situated right near the Opening Support / Resistance Zone (25,434 – 25,499). The market structure shows a short-term base building, with the index now oscillating between 25,434 on the downside and 25,617 on the upside. A breakout beyond either level could define the trend for the session.
Key levels to watch include:
🟢 Resistance Zones: 25,617 (Opening Resistance), 25,699 (Last Intraday Resistance), 25,863 (Next Upside Level)
🔴 Support Zones: 25,434 (Immediate), 25,366 (Last Intraday Support), 25,231 (Final Support)
With volatility expected due to global cues and options expiry positioning, traders should emphasize patience, discipline, and confirmation before entry.
🟢 Scenario 1: GAP-UP Opening (100+ Points)
If Nifty opens near or above 25,610 – 25,640, it will directly test the Opening Resistance zone. Bulls need to sustain above this level to maintain control.
- []If price sustains above 25,617 for 15–30 minutes with strong candle closings and rising volume, a move toward 25,699 and possibly 25,863 can unfold.
[]However, if price fails to sustain above 25,617 and forms rejection candles or bearish patterns (like shooting star or engulfing), traders can expect a pullback toward 25,510 – 25,499.
[]A failed breakout above 25,617 can offer a short-term shorting opportunity back into the consolidation range.
[]Avoid aggressive long entries immediately after the gap-up — wait for retests and volume confirmations.
💡 Educational Note:
A gap-up does not guarantee continuation. Many traders get trapped in "breakout euphoria" without waiting for confirmation. The key is sustained price action with strong volume. Smart traders often buy on dips after confirmation, not at the peak of the first candle.
🟧 Scenario 2: FLAT Opening (Within 25,434 – 25,499 Zone)
A flat opening inside the Opening Support / Resistance Zone will likely cause initial indecision. The market may first trap both sides before picking direction.
- []Avoid trading the first few 15-min candles if price stays within 25,434 – 25,499.
[]If price breaks above 25,499 decisively with strength, the momentum could carry it toward 25,617 and 25,699.
[]If price breaks below 25,434, it may drag the index lower toward 25,366, and in case of strong selling, 25,231.
[]Ideal strategy: Wait for breakouts with closing confirmation. Avoid countertrend trades in this setup.
🧠 Educational Tip:
Flat openings test patience — they’re designed to frustrate impulsive traders. Remember: The first move after a flat open is often false. Wait for clear direction confirmed by price structure and volume alignment before taking a stance.
🔴 Scenario 3: GAP-DOWN Opening (100+ Points)
If Nifty opens below 25,410 or near 25,366, sentiment may turn weak initially, bringing the Last Intraday Support (25,366 – 25,231) into focus.
- []If a reversal candle forms near 25,366 – 25,231 (hammer or bullish engulfing), traders can look for short-covering opportunities toward 25,434 – 25,499.
[]However, if price sustains below 25,366, then weakness can extend further, possibly toward 25,200 – 25,150 zones.
[]Avoid shorting immediately after a big gap-down. Wait for a pullback toward resistance levels for better entry and risk-reward balance.
[]Volume confirmation near support zones is critical — weak volume during selloffs often precedes reversals.
📘 Educational Insight:
Gap-downs tend to trigger fear-based selling early in the session. The best approach is to observe — not react — in the first few minutes. If buyers start stepping in near strong support levels, that’s often where reversals begin. Let price tell you its story before taking sides.
💼 RISK MANAGEMENT TIPS FOR OPTIONS TRADERS:
- []Avoid buying options during the first 15 minutes of volatile openings — inflated IV spikes can cause fast premium decay.
[]Always define your stop-loss before entry and risk a maximum of 1–2% of total capital per trade.
[]Use ITM options for cleaner directional plays; avoid far OTM contracts unless volatility breakout is confirmed.
[]Trail stop-losses once your trade moves 30–40 points in your favor — protect profits and minimize emotional exits. - Never trade without a plan. The best traders protect their capital first, profits come next.
📈 SUMMARY:
- []🟧 Opening Support / Resistance Zone: 25,434 – 25,499[]🟥 Resistance Zones: 25,617 / 25,699 / 25,863[]🟩 Support Zones: 25,434 / 25,366 / 25,231[]⚖️ Bias: Neutral-to-Bullish above 25,499 | Weakness below 25,434
📚 CONCLUSION:
Nifty is currently at a pivotal range, consolidating before its next major breakout. The 25,434 – 25,499 zone is the short-term decision point. A break above 25,499 can reignite bullish sentiment, while a fall below 25,434 may extend weakness toward 25,366 or even 25,231.
Be patient during the opening volatility and focus on clarity over speed. The first 15–30 minutes often decide the day’s fate — don’t rush into uncertain setups.
📊 Consistency in following your plan is more powerful than chasing every move.
⚠️ DISCLAIMER:
I am not a SEBI-registered analyst. The views and levels shared are for educational purposes only. Please do your own research or consult a registered financial advisor before making any trading or investment decisions.
Thông báo miễn trừ trách nhiệm
Thông tin và các ấn phẩm này không nhằm mục đích, và không cấu thành, lời khuyên hoặc khuyến nghị về tài chính, đầu tư, giao dịch hay các loại khác do TradingView cung cấp hoặc xác nhận. Đọc thêm tại Điều khoản Sử dụng.
Thông báo miễn trừ trách nhiệm
Thông tin và các ấn phẩm này không nhằm mục đích, và không cấu thành, lời khuyên hoặc khuyến nghị về tài chính, đầu tư, giao dịch hay các loại khác do TradingView cung cấp hoặc xác nhận. Đọc thêm tại Điều khoản Sử dụng.