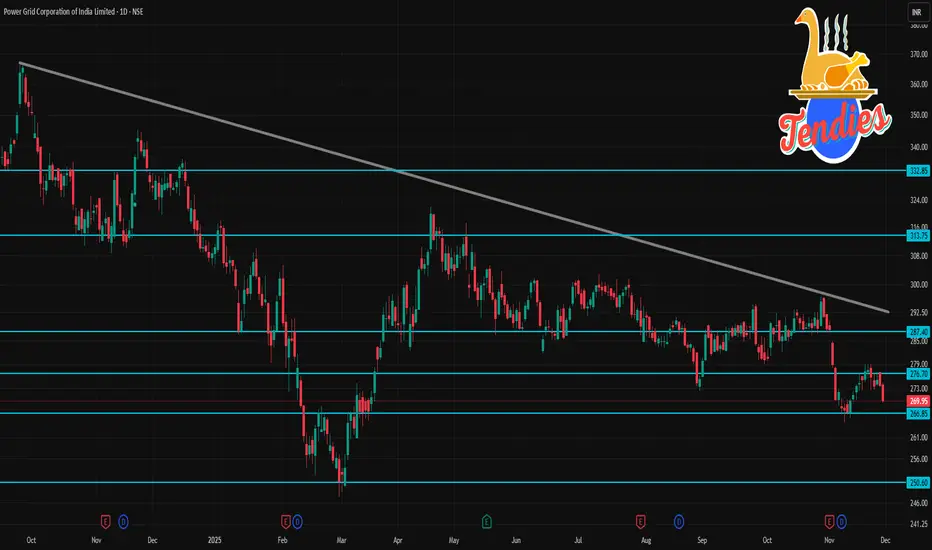
📊 POWERGRID — Current snapshot (daily timeframe)
As of last close, POWERGRID was trading around ₹ 269.95.
The 52-week trading range is roughly ₹ 247.30 (low) to ₹ 336.25 (high).
Over the past week, the share price is down about 2.76%, and over the last 6 months, down about 7.3%.
📈 Technical Indicators (Daily Chart)
According to a technical-analysis summary, moving averages and oscillators on daily timeframe show a “Strong Sell” signal for POWERGRID.
The 14-day RSI is near 31, which is close to oversold territory — indicating potential weakness or risk of a further drop.
Some charting platforms show mixed signals (some “sell”, some “neutral”), but overall bias remains bearish to weak, not bullish.
Bài đăng liên quan
Thông báo miễn trừ trách nhiệm
Thông tin và các ấn phẩm này không nhằm mục đích, và không cấu thành, lời khuyên hoặc khuyến nghị về tài chính, đầu tư, giao dịch hay các loại khác do TradingView cung cấp hoặc xác nhận. Đọc thêm tại Điều khoản Sử dụng.
Bài đăng liên quan
Thông báo miễn trừ trách nhiệm
Thông tin và các ấn phẩm này không nhằm mục đích, và không cấu thành, lời khuyên hoặc khuyến nghị về tài chính, đầu tư, giao dịch hay các loại khác do TradingView cung cấp hoặc xác nhận. Đọc thêm tại Điều khoản Sử dụng.