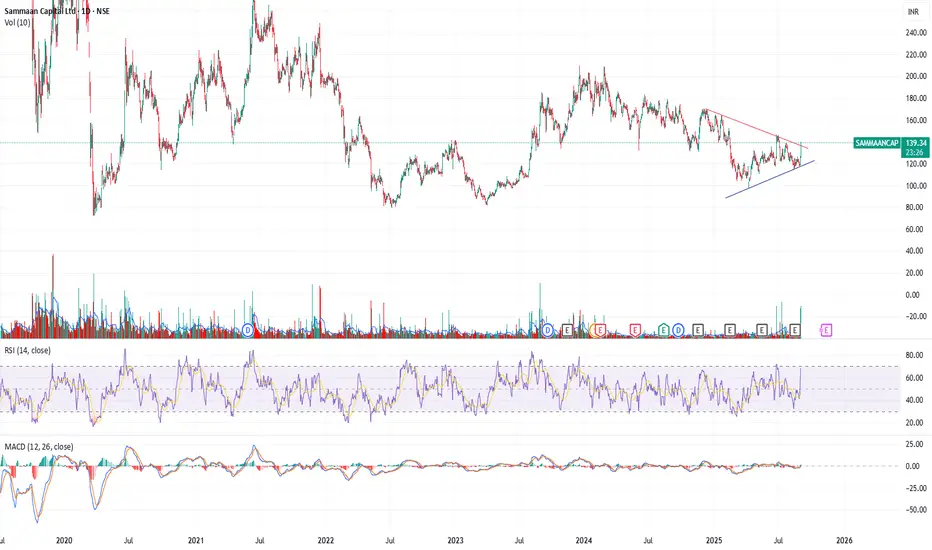
The chart for SAMMAANCAP (NSE) is signaling a bullish breakout from a symmetrical triangle or wedge pattern, propelled by a sharp jump in price (+10.66%) and a substantial surge in trading volume, which often marks the start of upward momentum. Technical indicators reinforce this bullishness: the RSI is near 68, approaching overbought territory but not yet extreme, and the MACD shows a positive crossover with growing histogram strength, both pointing to continued upside potential. With price now above short-term moving averages (EMA 9, 21, 50), and volume confirming the breakout, a fresh long position can be considered above ₹138 with a stop loss around ₹126, and first targets near ₹150–₹160 where previous resistance lie
Thông báo miễn trừ trách nhiệm
The information and publications are not meant to be, and do not constitute, financial, investment, trading, or other types of advice or recommendations supplied or endorsed by TradingView. Read more in the Terms of Use.
Thông báo miễn trừ trách nhiệm
The information and publications are not meant to be, and do not constitute, financial, investment, trading, or other types of advice or recommendations supplied or endorsed by TradingView. Read more in the Terms of Use.