Key Intraday Metrics (Sep 3, 2025 – by mid-day)
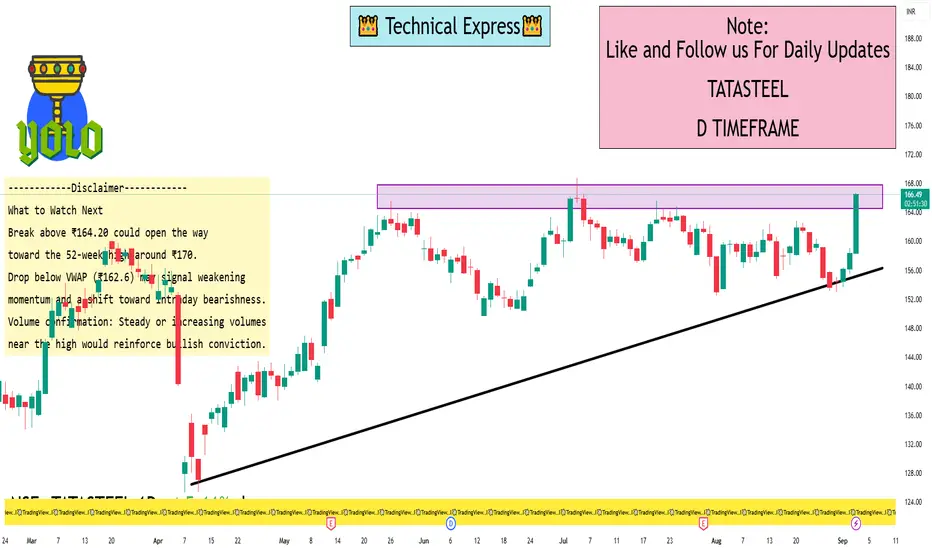
Previous Close: ₹158.39
Today’s Trading Range: ₹158.40 (Low) to ₹164.20 (High)
Latest Price: Around ₹164.42, marking a gain of approximately +3.8% for the day
VWAP (Volume-Weighted Average Price): ₹162.61
Interpretation: One-Day Price Levels
Support Level: Around ₹158.40 — this represents the daily low, serving as a key intraday support.
Resistance Level: Around ₹164.20, just below the intraday high, acting as key intraday resistance.
VWAP (~₹162.6): This level is significant—price above VWAP indicates bullish pressure; below suggests bearish sentiment.
The stock is trading above both VWAP and the previous close, which is a sign of short-term bullishness.
Additional Context & Perspective
Short-Term Trend: According to TradingView’s technical indicators, the 1-day view shows a “strong buy”, and the 1-week view remains a “buy”
Momentum & Breadth: The 50-day and 20-day moving average crossovers suggest potential follow-through, with historical averages showing gains of ~5.6% within 30 days and ~3.7% within 7 days of such signals
52-Week Range: ₹122.62 (low) to ₹170.18 (high) — today’s high sits well within this broader context
I built a Buy & Sell Signal Indicator with 85% accuracy.
📈 Get access via DM or
WhatsApp: wa.link/d997q0
Contact - +91 76782 40962
| Email: techncialexpress@gmail.com
| Script Coder | Trader | Investor | From India
📈 Get access via DM or
WhatsApp: wa.link/d997q0
Contact - +91 76782 40962
| Email: techncialexpress@gmail.com
| Script Coder | Trader | Investor | From India
Bài đăng liên quan
Thông báo miễn trừ trách nhiệm
Thông tin và các ấn phẩm này không nhằm mục đích, và không cấu thành, lời khuyên hoặc khuyến nghị về tài chính, đầu tư, giao dịch hay các loại khác do TradingView cung cấp hoặc xác nhận. Đọc thêm tại Điều khoản Sử dụng.