Lines and boxes
Introduction
Pine Script™ facilitates drawing lines, boxes, and other geometric formations from code using the line, box, and polyline types. These types provide utility for programmatically drawing support and resistance levels, trend lines, price ranges, and other custom formations on a chart.
Unlike plots, the flexibility of these types makes them particularly well-suited for visualizing current calculated data at virtually any available point on the chart, irrespective of the chart bar the script executes on.
Lines, boxes, and polylines are objects, like labels, tables, and other special types. Scripts reference objects of these types using IDs, which act like pointers. As with other objects, line, box, and polyline IDs are qualified as “series” values, and all functions that manage these objects accept “series” arguments.
Note
Using the types we discuss on this page often involves arrays, especially when working with polylines, which require an array of chart.point instances. We therefore recommend you become familiar with arrays to make the most of these drawing types in your scripts.
Lines drawn by a script may be vertical, horizontal, or angled. Boxes are always rectangular. Polylines sequentially connect multiple vertical, horizontal, angled, or curved line segments. Although all of these drawing types have different characteristics, they do have some things in common:
- Lines, boxes, and polylines can have coordinates at any available location on the chart, including ones at future times beyond the last chart bar.
- Objects of these types can use chart.point instances to set their coordinates.
- The x-coordinates of each object can be bar index or time values, depending on their specified
xlocproperty. - Each object can have one of multiple predefined line styles.
- Scripts can call the functions that manage these objects from within the scopes of loops and conditional structures, allowing iterative and conditional control of their drawings.
- There are limits on the number of these objects that a script can reference and display on the chart. A single script instance can
display up to 500 lines, 500 boxes, and 100 polylines. Users can specify the maximum number allowed for each type via the
max_lines_count,max_boxes_count, andmax_polylines_countparameters of the script’s indicator() or strategy() declaration statement. If unspecified, the default is ~50. As with label and table types, lines, boxes, and polylines utilize a garbage collection mechanism that deletes the oldest objects on the chart when the total number of drawings exceeds the script’s limit.
Note
On TradingView charts, a complete set of Drawing Tools allows users to create and modify drawings using mouse actions. While they may sometimes resemble drawing objects created with Pine Script™ code, they are unrelated entities. Pine scripts cannot interact with drawing tools from the chart user interface, and mouse actions do not directly affect Pine drawing objects.
Lines
The built-ins in the line.* namespace control the creation and management of
line objects:
- The line.new() function creates a new line.
- The
line.set_*()functions modify line properties. - The
line.get_*()functions retrieve values from a line instance. - The line.copy() function clones a line instance.
- The line.delete() function deletes an existing line instance.
- The line.all variable references a read-only
array containing the IDs of all lines displayed by the script.
The array’s size depends on the
max_lines_countof the indicator() or strategy() declaration statement and the number of lines the script has drawn.
Scripts can call line.set_*(), line.get_*(),
line.copy(),
and line.delete()
built-ins as functions or methods.
Creating lines
The line.new() function creates a new line instance to display on the chart. It has the following signatures:
line.new(first_point, second_point, xloc, extend, color, style, width) → series line

line.new(x1, y1, x2, y2, xloc, extend, color, style, width) → series line
The first overload of this function contains the first_point and second_point parameters.
The first_point is a chart.point
representing the start of the line, and the second_point is a
chart.point representing
the line’s end. The function copies the information from these chart points
to determine the line’s coordinates. Whether it uses the index or time fields from the first_point
and second_point as x-coordinates depends on the function’s xloc value.
The second overload specifies x1, y1, x2, and y2 values independently, where x1 and x2
are int values representing the starting and
ending x-coordinates of the line, and y1 and y2 are
float values representing the y-coordinates.
Whether the line considers the x values as bar indices or timestamps depends on the xloc value in the function call.
Both overloads share the same additional parameters:
xlocControls whether the x-coordinates of the new line use bar index or time values. Its default value is xloc.bar_index.
When calling the first overload, using an
xlocvalue of xloc.bar_index tells the function to use theindexfields of thefirst_pointandsecond_point, and a value of xloc.bar_time tells the function to use thetimefields of the points.When calling the second overload, an
xlocvalue of xloc.bar_index prompts the function to treat thex1andx2arguments as bar index values. When using xloc.bar_time, the function will treatx1andx2as time values.When the specified x-coordinates represent bar index values, it’s important to note that the minimum x-coordinate allowed is
bar_index - 9999. For larger offsets, one can use xloc.bar_time.extend- Determines whether the drawn line will infinitely extend beyond its defined start and end coordinates. It accepts one of the following values: extend.left, extend.right, extend.both, or extend.none (default).
color- Specifies the color of the line drawing. The default is color.blue.
style- Specifies the line’s style, which can be any of the options listed in this page’s Line styles section. The default value is line.style_solid.
width- Controls the width of the line, in pixels. The default value is 1.
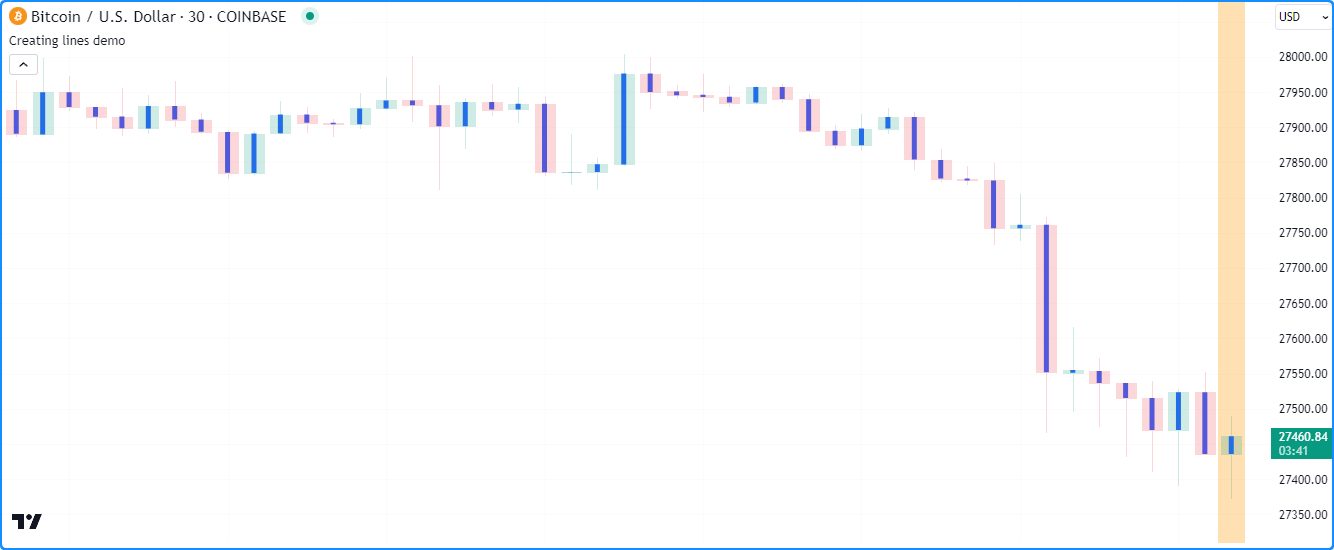
The example below demonstrates how one can draw lines in their simplest form. This script draws a new vertical line connecting the open and close prices at the horizontal center of each chart bar:
//@version=5
indicator("Creating lines demo", overlay = true)

//@variable The `chart.point` for the start of the line. Contains `index` and `time` information.
firstPoint = chart.point.now(open)
//@variable The `chart.point` for the end of the line. Contains `index` and `time` information.
secondPoint = chart.point.now(close)

// Draw a basic line with a `width` of 5 connecting the `firstPoint` to the `secondPoint`.
// This line uses the `index` field from each point for its x-coordinates.
line.new(firstPoint, secondPoint, width = 5)

// Color the background on the unconfirmed bar.
bgcolor(barstate.isconfirmed ? na : color.new(color.orange, 70), title = "Unconfirmed bar highlight")
- Note that:
- If the
firstPointandsecondPointreference identical coordinates, the script will not display a line since there is no distance between them to draw. However, the line ID will still exist. - The script will only display approximately the last 50 lines on the chart, as it does not have a specified
max_lines_countin the indicator() function call. Line drawings persist on the chart until deleted using line.delete() or removed by the garbage collector. - The script redraws the line on the open chart bar (i.e., the bar with an orange background highlight) until it closes. After the bar closes, it will no longer update the drawing.
- If the
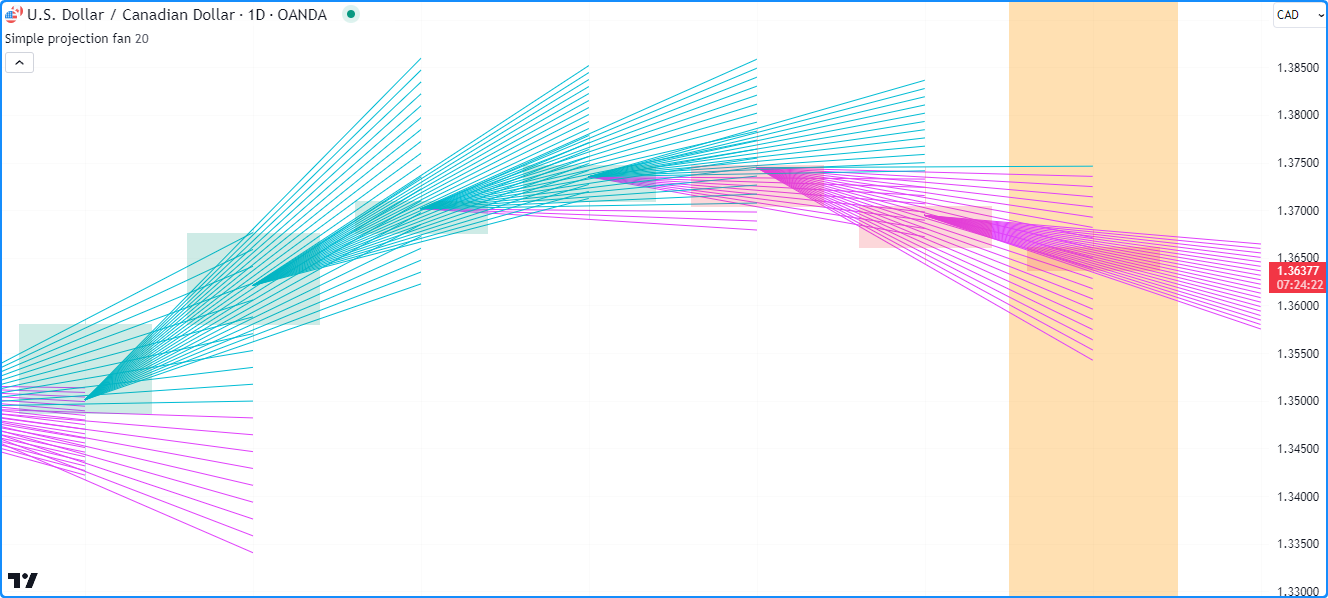
Let’s look at a more involved example. This script uses the previous bar’s
hl2 price
and the current bar’s high
and low prices to draw a fan
with a user-specified number of lines projecting a range of hypothetical price values for the following chart bar.
It calls line.new() within a
for loop to create linesPerBar lines on each bar:
//@version=5
indicator("Creating lines demo", "Simple projection fan", true, max_lines_count = 500)

//@variable The number of fan lines drawn on each chart bar.
int linesPerBar = input.int(20, "Line drawings per bar", 2, 100)

//@variable The distance between each y point on the current bar.
float step = (high - low) / (linesPerBar - 1)

//@variable The `chart.point` for the start of each line. Does not contain `time` information.
firstPoint = chart.point.from_index(bar_index - 1, hl2[1])
//@variable The `chart.point` for the end of each line. Does not contain `time` information.
secondPoint = chart.point.from_index(bar_index + 1, float(na))

//@variable The stepped y value on the current bar for `secondPoint.price` calculation, starting from the `low`.
float barValue = low
// Loop to draw the fan.
for i = 1 to linesPerBar
    // Update the `price` of the `secondPoint` using the difference between the `barValue` and `firstPoint.price`.
    secondPoint.price := 2.0 * barValue - firstPoint.price
    //@variable Is `color.aqua` when the line's slope is positive, `color.fuchsia` otherwise.
    color lineColor = secondPoint.price > firstPoint.price ? color.aqua : color.fuchsia
    // Draw a new `lineColor` line connecting the `firstPoint` and `secondPoint` coordinates.
    // This line uses the `index` field from each point for its x-coordinates.
    line.new(firstPoint, secondPoint, color = lineColor)
    // Add the `step` to the `barValue`.
    barValue += step

// Color the background on the unconfirmed bar.
bgcolor(barstate.isconfirmed ? na : color.new(color.orange, 70), title = "Unconfirmed bar highlight")
- Note that:
- We’ve included
max_lines_count = 500in the indicator() function call, meaning the script preserves up to 500 lines on the chart. - Each line.new() call copies the information from the
chart.point referenced by the
firstPointandsecondPointvariables. As such, the script can change thepricefield of thesecondPointon each loop iteration without affecting the y-coordinates in other lines.
- We’ve included
Modifying lines
The line.* namespace contains multiple setter functions that modify the properties
of line instances:
- line.set_first_point() and
line.set_second_point()
respectively update the start and end points of the
idline using information from the specifiedpoint. - line.set_x1() and
line.set_x2() set one of the
x-coordinates of the
idline to a newxvalue, which can represent a bar index or time value depending on the line’sxlocproperty. - line.set_y1() and
line.set_y2() set one of the
y-coordinates of the
idline to a newyvalue. - line.set_xy1() and
line.set_xy2() update one of the
idline’s points with newxandyvalues. - line.set_xloc() sets the
xlocof theidline and updates both of its x-coordinates with newx1andx2values. - line.set_extend() sets the
extendproperty of theidline. - line.set_color() updates the
idline’scolorvalue. - line.set_style() changes the
styleof theidline. - line.set_width() sets the
widthof theidline.
All setter functions directly modify the id line passed into the call and do not return any value.
Each setter function accepts “series” arguments, as a script can change a line’s properties throughout its execution.
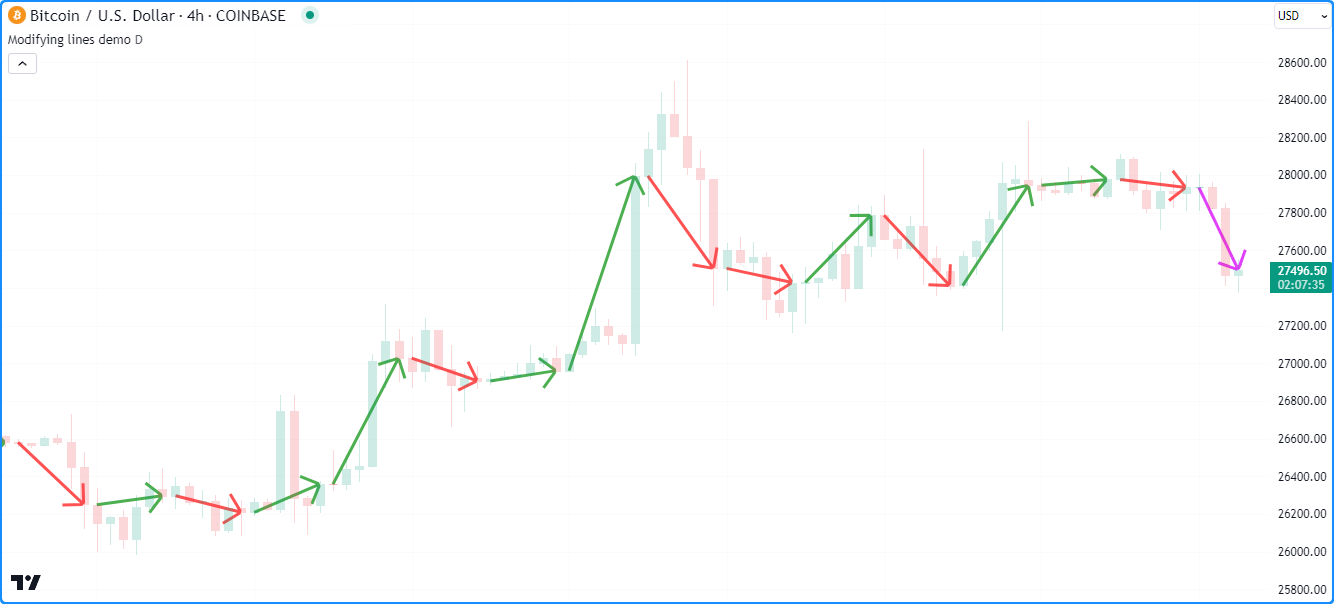
The following example draws lines connecting the opening price of a timeframe to its closing price.
The script uses the var keyword to declare the periodLine
and the variables that reference chart.point
values (openPoint and closePoint) only on the first chart bar, and it assigns new values to these variables over its execution.
After detecting a change on the
timeframe, it sets the color of the existing periodLine using
line.set_color(), creates new values for
the openPoint and closePoint using chart.point.now(),
then assigns a new line using those points to the periodLine.
On other bars where the periodLine value is not na, the script assigns
a new chart.point to the closePoint, then uses
line.set_second_point()
and line.set_color() as
methods to update the line’s properties:
//@version=5
indicator("Modifying lines demo", overlay = true)

//@variable The size of each period.
string timeframe = input.timeframe("D", "Timeframe")

//@variable A line connecting the period's opening and closing prices.
var line periodLine = na

//@variable The first point of the line. Contains `time` and `index` information.
var chart.point openPoint = chart.point.now(open)
//@variable The closing point of the line. Contains `time` and `index` information.
var chart.point closePoint = chart.point.now(close)

if timeframe.change(timeframe)
    //@variable The final color of the `periodLine`.
    color finalColor = switch
        closePoint.price > openPoint.price => color.green
        closePoint.price < openPoint.price => color.red
        =>                                    color.gray

    // Update the color of the current `periodLine` to the `finalColor`.
    line.set_color(periodLine, finalColor)

    // Assign new points to the `openPoint` and `closePoint`.
    openPoint  := chart.point.now(open)
    closePoint := chart.point.now(close)
    // Assign a new line to the `periodLine`. Uses `time` fields from the `openPoint` and `closePoint` as x-coordinates.
    periodLine := line.new(openPoint, closePoint, xloc.bar_time, style = line.style_arrow_right, width = 3)

else if not na(periodLine)
    // Assign a new point to the `closePoint`.
    closePoint := chart.point.now(close)

    //@variable The color of the developing `periodLine`.
    color developingColor = switch
        closePoint.price > openPoint.price => color.aqua
        closePoint.price < openPoint.price => color.fuchsia
        =>                                    color.gray

    // Update the coordinates of the line's second point using the new `closePoint`.
    // It uses the `time` field from the point for its new x-coordinate.
    periodLine.set_second_point(closePoint)
    // Update the color of the line using the `developingColor`.
    periodLine.set_color(developingColor)
- Note that:
- Each line drawing in this example uses the line.style_arrow_right style. See the Line styles section below for an overview of all available style settings.
Line styles
Users can control the style of their scripts’ line drawings by passing one of the following variables as the
style argument in their line.new() or
line.set_style() function calls:
| Argument | Line | Argument | Line | |
|---|---|---|---|---|
line.style_solid |
 |
line.style_arrow_left |
||
line.style_dotted |
 |
line.style_arrow_right |
||
line.style_dashed |
 |
line.style_arrow_both |
- Note that:
- Polylines can also use any of these variables as their
line_stylevalue. See the Creating polylines section of this page.
- Polylines can also use any of these variables as their
Reading line values
The line.* namespace includes getter functions, which allow a script to retrieve values from a
line object for further use:
- line.get_x1() and
line.get_x2() respectively
get the first and second x-coordinate from the
idline. Whether the value returned represents a bar index or time value depends on the line’sxlocproperty. - line.get_y1() and
line.get_y2() respectively get
the
idline’s first and second y-coordinate. - line.get_price() retrieves
the price (y-coordinate) from a line
idat a specifiedxvalue, including at bar indices outside the line’s start and end points. This function is only compatible with lines that use xloc.bar_index as thexlocvalue.
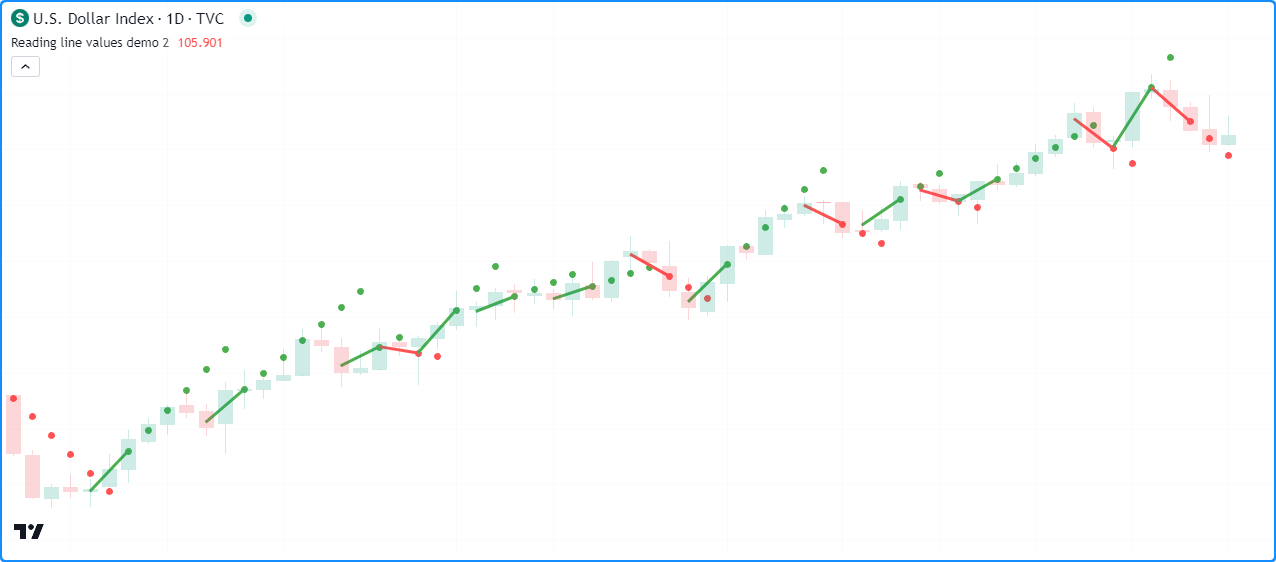
The script below draws a new line upon the onset of a rising
or falling price pattern
forming over length bars. It uses the var keyword to
declare the directionLine variable on the first chart bar. The ID assigned to the directionLine persists over
subsequent bars until the newDirection condition occurs, in which case the script assigns a new line to the variable.
On every bar, the script calls the line.get_y2(),
line.get_y1(),
line.get_x2(), and
line.get_x1() getters as methods
to retrieve values from the current directionLine and calculate its slope, which it uses to determine the color of each
drawing and plot. It retrieves extended values of the directionLine from beyond its second point using
line.get_price() and
plots them on the chart:
//@version=5
indicator("Reading line values demo", overlay = true)

//@variable The number of bars for rising and falling calculations.
int length = input.int(2, "Length", 2)

//@variable A line that's drawn whenever `hlc3` starts rising or falling over `length` bars.
var line directionLine = na

//@variable Is `true` when `hlc3` is rising over `length` bars, `false` otherwise.
bool rising = ta.rising(hlc3, length)
//@variable Is `true` when `hlc3` is falling over `length` bars, `false` otherwise.
bool falling = ta.falling(hlc3, length)
//@variable Is `true` when a rising or falling pattern begins, `false` otherwise.
bool newDirection = (rising and not rising[1]) or (falling and not falling[1])

// Update the `directionLine` when `newDirection` is `true`. The line uses the default `xloc.bar_index`.
if newDirection
    directionLine := line.new(bar_index - length, hlc3[length], bar_index, hlc3, width = 3)

//@variable The slope of the `directionLine`.
float slope = (directionLine.get_y2() - directionLine.get_y1()) / (directionLine.get_x2() - directionLine.get_x1())
//@variable The value extrapolated from the `directionLine` at the `bar_index`.
float lineValue = line.get_price(directionLine, bar_index)

//@variable Is `color.green` when the `slope` is positive, `color.red` otherwise.
color slopeColor = slope > 0 ? color.green : color.red

// Update the color of the `directionLine`.
directionLine.set_color(slopeColor)
// Plot the `lineValue`.
plot(lineValue, "Extrapolated value", slopeColor, 3, plot.style_circles)
- Note that:
- This example calls the second overload of the line.new()
function, which uses
x1,y1,x2, andy2parameters to define the start and end points of the line. Thex1value islengthbars behind the current bar_index, and they1value is the hlc3 value at that index. Thex2andy2in the function call use the current bar’s bar_index and hlc3 values. - The line.get_price() function call treats the
directionLineas though it extends infinitely, regardless of itsextendproperty. - The script only displays approximately the last 50 lines on the chart, but the plot of extrapolated values spans throughout the chart’s history.
- This example calls the second overload of the line.new()
function, which uses
Cloning lines
Scripts can clone a line id and all its properties with the
line.copy() function.
Any changes to the copied line instance do not affect the original.
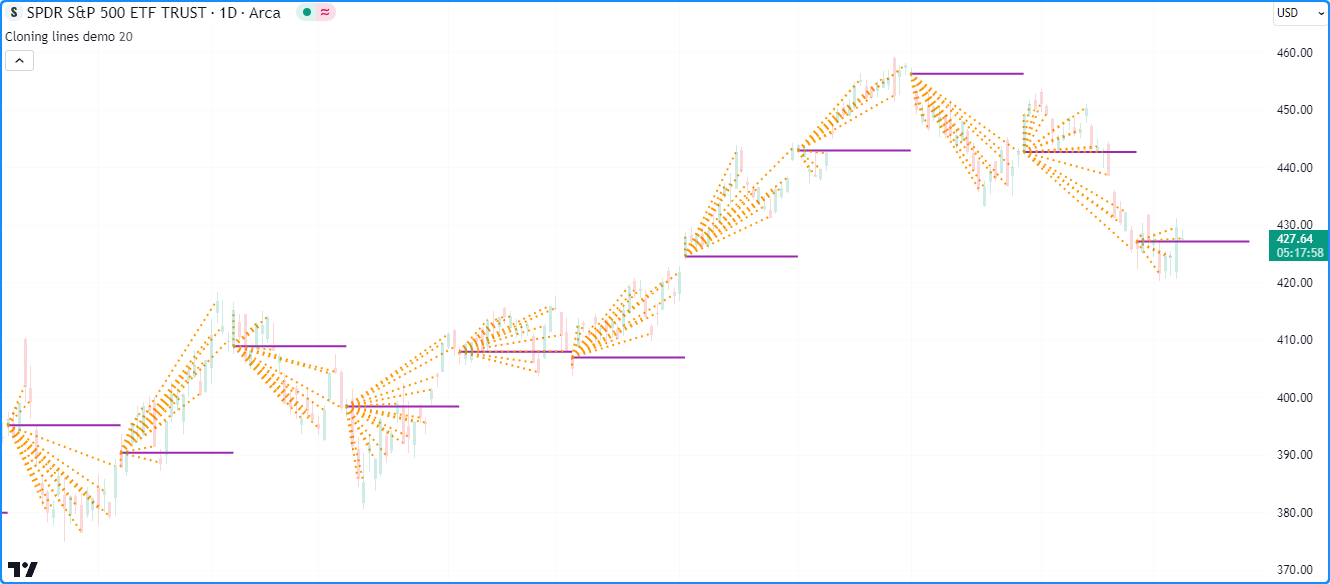
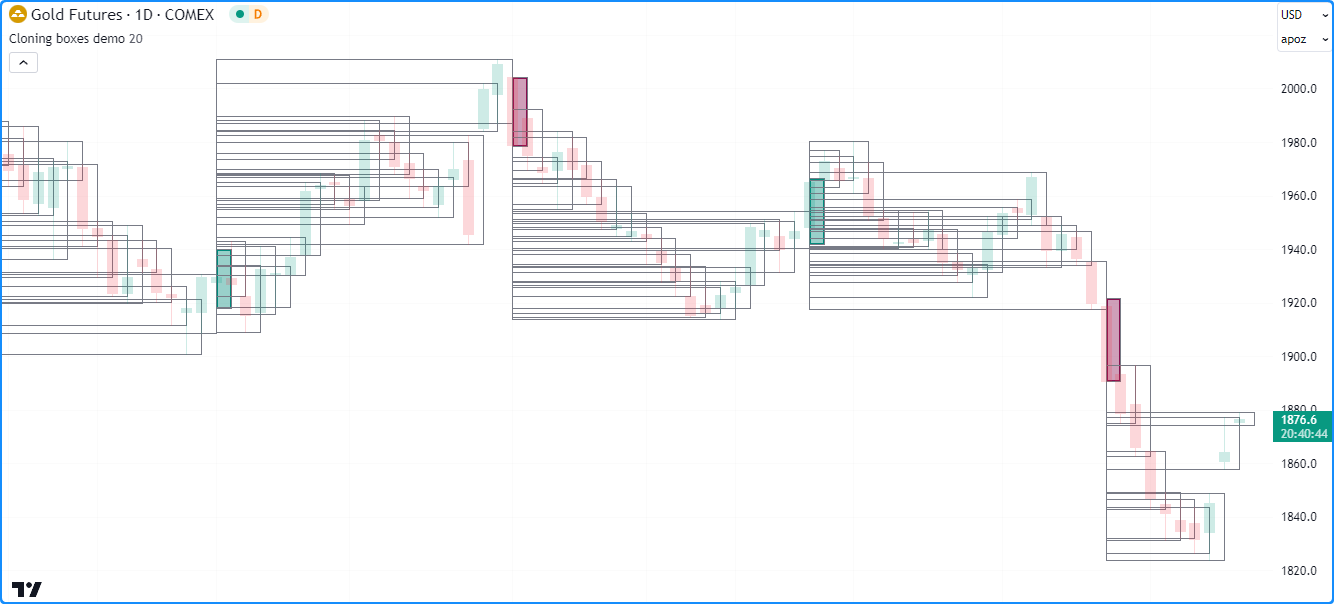
For example, this script creates a horizontal line at the the bar’s
open price once every
length bars, which it assigns to a mainLine variable. On all other bars, it creates
a copiedLine using line.copy()
and calls line.set_*() functions to modify its
properties. As we see below, altering the copiedLine does not affect the mainLine in
any way:
//@version=5
indicator("Cloning lines demo", overlay = true, max_lines_count = 500)

//@variable The number of bars between each new mainLine assignment.
int length = input.int(20, "Length", 2, 500)

//@variable The first `chart.point` used by the `mainLine`. Contains `index` and `time` information.
firstPoint = chart.point.now(open)
//@variable The second `chart.point` used by the `mainLine`. Does not contain `time` information.
secondPoint = chart.point.from_index(bar_index + length, open)

//@variable A horizontal line drawn at the `open` price once every `length` bars.
var line mainLine = na

if bar_index % length == 0
    // Assign a new line to the `mainLine` that connects the `firstPoint` to the `secondPoint`.
    // This line uses the `index` fields from both points as x-coordinates.
    mainLine := line.new(firstPoint, secondPoint, color = color.purple, width = 2)

//@variable A copy of the `mainLine`. Changes to this line do not affect the original.
line copiedLine = line.copy(mainLine)

// Update the color, style, and second point of the `copiedLine`.
line.set_color(copiedLine, color.orange)
line.set_style(copiedLine, line.style_dotted)
line.set_second_point(copiedLine, chart.point.now(close))
- Note that:
- The
indexfield of thesecondPointislengthbars beyond the current bar_index. Since the maximum x-coordinate allowed with xloc.bar_index isbar_index + 500, we’ve set themaxvalof thelengthinput to 500.
- The
Deleting lines
To delete a line id drawn by a script, use the
line.delete() function.
This function removes the line instance from the script and its drawing on the chart.
Deleting line instances is often handy when one wants to only keep a specific number of lines on the chart at any given time or conditionally remove drawings as a chart progresses.
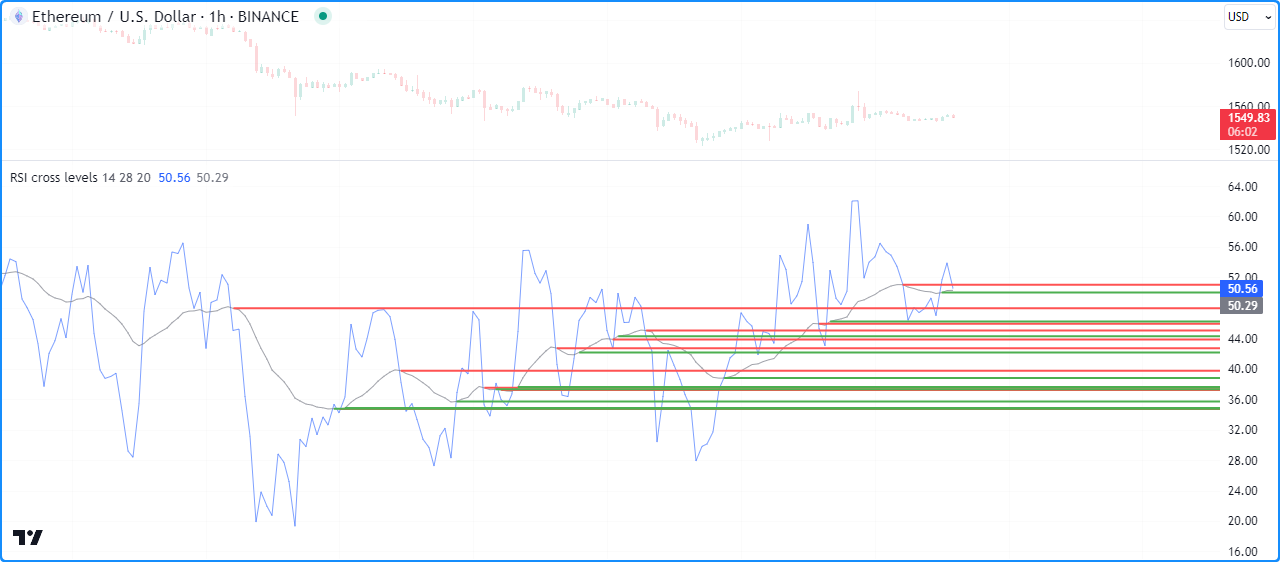
For example, this script draws a horizontal line with the extend.right property whenever an RSI crosses its EMA.
The script stores all line IDs in a lines array that it
uses as a queue
to only display the last numberOfLines on the chart. When the
size of the
array exceeds the specified
numberOfLines, the script removes the array’s oldest line ID using
array.shift() and
deletes it with line.delete():
//@version=5

//@variable The maximum number of lines allowed on the chart.
const int MAX_LINES_COUNT = 500

indicator("Deleting lines demo", "RSI cross levels", max_lines_count = MAX_LINES_COUNT)

//@variable The length of the RSI.
int rsiLength = input.int(14, "RSI length", 2)
//@variable The length of the RSI's EMA.
int emaLength = input.int(28, "RSI average length", 2)
//@variable The maximum number of lines to keep on the chart.
int numberOfLines = input.int(20, "Lines on the chart", 0, MAX_LINES_COUNT)

//@variable An array containing the IDs of lines on the chart.
var array<line> lines = array.new<line>()

//@variable An `rsiLength` RSI of `close`.
float rsi = ta.rsi(close, rsiLength)
//@variable A `maLength` EMA of the `rsi`.
float rsiMA = ta.ema(rsi, emaLength)

if ta.cross(rsi, rsiMA)
    //@variable The color of the horizontal line.
    color lineColor = rsi > rsiMA ? color.green : color.red
    // Draw a new horizontal line. Uses the default `xloc.bar_index`.
    newLine = line.new(bar_index, rsiMA, bar_index + 1, rsiMA, extend = extend.right, color = lineColor, width = 2)
    // Push the `newLine` into the `lines` array.
    lines.push(newLine)
    // Delete the oldest line when the size of the array exceeds the specified `numberOfLines`.
    if array.size(lines) > numberOfLines
        line.delete(lines.shift())

// Plot the `rsi` and `rsiMA`.
plot(rsi, "RSI", color.new(color.blue, 40))
plot(rsiMA, "EMA of RSI", color.new(color.gray, 30))
- Note that:
- We declared a
MAX_LINES_COUNTvariable with the “const int” qualified type, which the script uses as themax_lines_countin the indicator() function and themaxvalof the input.int() assigned to thenumberOfLinesvariable. - This example uses the second overload of the line.new()
function, which specifies
x1,y1,x2, andy2coordinates independently.
- We declared a
Filling the space between lines
Scripts can fill the space between two line drawings
by creating a linefill object that references them with the
linefill.new() function. Linefills automatically
determine their fill boundaries using the properties from the line1 and line2 IDs that they reference.
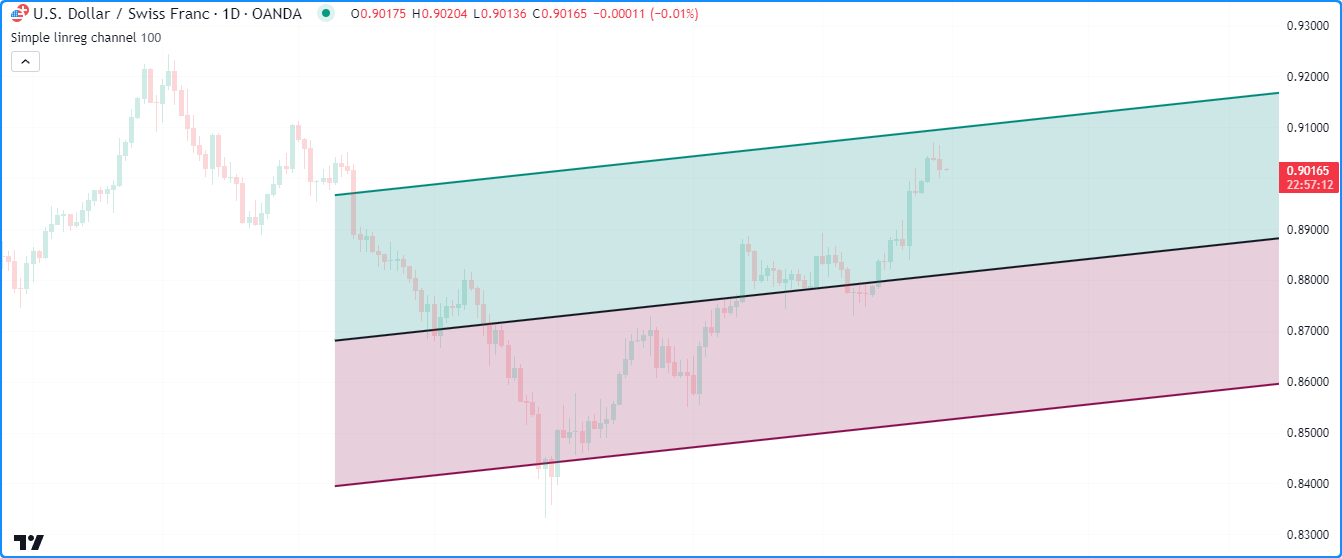
For example, this script calculates a simple linear regression channel. On the first chart bar, the script declares the
basisLine, upperLine, and lowerLine variables to reference the channel’s
line IDs, then it makes two
linefill.new() calls to create
linefill objects that fill the upper and lower portions
of the channel. The first linefill fills the space
between the basisLine and the upperLine, and the second fills the space between the basisLine and lowerLine.
The script updates the coordinates of the lines across subsequent bars. However, notice that the script never needs to update the linefills declared on the first bar. They automatically update their fill regions based on the coordinates of their assigned lines:
//@version=5
indicator("Filling the space between lines demo", "Simple linreg channel", true)

//@variable The number of bars in the linear regression calculation.
int lengthInput = input.int(100)

//@variable The basis line of the regression channel.
var line basisLine = line.new(na, na, na, na, extend = extend.right, color = chart.fg_color, width = 2)
//@variable The channel's upper line.
var line upperLine = line.new(na, na, na, na, extend = extend.right, color = color.teal, width = 2)
//@variable The channel's lower line.
var line lowerLine = line.new(na, na, na, na, extend = extend.right, color = color.maroon, width = 2)

//@variable A linefill instance that fills the space between the `basisLine` and `upperLine`.
var linefill upperFill = linefill.new(basisLine, upperLine, color.new(color.teal, 80))
//@variable A linefill instance that fills the space between the `basisLine` and `lowerLine`.
var linefill lowerFill = linefill.new(basisLine, lowerLine, color.new(color.maroon, 80))

// Update the `basisLine` coordinates with current linear regression values.
basisLine.set_xy1(bar_index + 1 - lengthInput, ta.linreg(close, lengthInput, lengthInput - 1))
basisLine.set_xy2(bar_index, ta.linreg(close, lengthInput, 0))

//@variable The channel's standard deviation.
float stDev = 0.0
for i = 0 to lengthInput - 1
    stDev += math.pow(close[i] - line.get_price(basisLine, bar_index - i), 2)
stDev := math.sqrt(stDev / lengthInput) * 2.0

// Update the `upperLine` and `lowerLine` using the values from the `basisLine` and the `stDev`.
upperLine.set_xy1(basisLine.get_x1(), basisLine.get_y1() + stDev)
upperLine.set_xy2(basisLine.get_x2(), basisLine.get_y2() + stDev)
lowerLine.set_xy1(basisLine.get_x1(), basisLine.get_y1() - stDev)
lowerLine.set_xy2(basisLine.get_x2(), basisLine.get_y2() - stDev)
To learn more about the linefill type, see this section of the Fills page.
Boxes
The built-ins in the box.* namespace create and manage
box objects:
- The box.new() function creates a new box.
- The
box.set_*()functions modify box properties. - The
box.get_*()functions retrieve values from a box instance. - The box.copy() function clones a box instance.
- The box.delete() function deletes a box instance.
- The box.all variable references a read-only
array containing the IDs of all boxes displayed by the script.
The array’s size depends on the
max_boxes_countof the indicator() or strategy() declaration statement and the number of boxes the script has drawn.
As with lines, users can call box.set_*(), box.get_*(),
box.copy(), and
box.delete() built-ins as
functions or methods.
Creating boxes
The box.new() function creates a new box object to display on the chart. It has the following signatures:
box.new(top_left, bottom_right, border_color, border_width, border_style, extend, xloc, bgcolor, text, text_size, text_color, text_halign, text_valign, text_wrap, text_font_family) → series box

box.new(left, top, right, bottom, border_color, border_width, border_style, extend, xloc, bgcolor, text, text_size, text_color, text_halign, text_valign, text_wrap, text_font_family) → series box
This function’s first overload includes the top_left and bottom_right parameters,
which accept chart.point objects
representing the top-left and bottom-right corners of the box, respectively. The function copies the information
from these chart points to set the coordinates of the box’s corners.
Whether it uses the index or time fields of the top_left and bottom_right points as x-coordinates
depends on the function’s xloc value.
The second overload specifies left, top, right, and bottom edges of the box. The left and right
parameters accept int values specifying the box’s
left and right x-coordinates, which can be bar index or time values depending on the xloc value in the function call.
The top and bottom parameters accept float
values representing the box’s top and bottom y-coordinates.
The function’s additional parameters are identical in both overloads:
border_color- Specifies the color of all four of the box’s borders. The default is color.blue.
border_width- Specifies the width of the borders, in pixels. Its default value is 1.
border_style- Specifies the style of the borders, which can be any of the options in the Box styles section of this page.
extend- Determines whether the box’s borders extend infinitely beyond the left or right x-coordinates. It accepts one of the following values: extend.left, extend.right, extend.both, or extend.none (default).
xlocDetermines whether the left and right edges of the box use bar index or time values as x-coordinates. The default is xloc.bar_index.
In the first overload, an
xlocvalue of xloc.bar_index means that the function will use theindexfields of thetop_leftandbottom_rightchart points, and anxlocvalue of xloc.bar_time means that it will use theirtimefields.In the second overload, using an
xlocvalue of xloc.bar_index means the function treats theleftandrightvalues as bar indices, and xloc.bar_time means it will treat them as timestamps.When the specified x-coordinates represent bar index values, it’s important to note that the minimum x-coordinate allowed is
bar_index - 9999. For larger offsets, one can use xloc.bar_time.bgcolor- Specifies the background color of the space inside the box. The default value is color.blue.
text- The text to display inside the box. By default, its value is an empty string.
text_size- Specifies the size of the text within the box. It accepts one of the following values: size.tiny, size.small, size.normal, size.large, size.huge, or size.auto (default).
text_color- Controls the color of the text. Its default is color.black.
text_halign- Specifies the horizontal alignment of the text within the box’s boundaries. It accepts one of the following: text.align_left, text.align_right, or text.align_center (default).
text_valign- Specifies the vertical alignment of the text within the box’s boundaries. It accepts one of the following: text.align_top, text.align_bottom, or text.align_center (default).
text_wrap- Determines whether the box will wrap the text within it. If its value is text.wrap_auto, the box wraps the text to ensure it does not span past its vertical borders. It also clips the wrapped text when it extends past the bottom. If the value is text.wrap_none, the box displays the text on a single line that can extend beyond its borders. The default is text.wrap_none.
text_font_family- Defines the font family of the box’s text. Using font.family_default displays the box’s text with the system’s default font. The font.family_monospace displays the text in a monospace format. The default value is font.family_default.
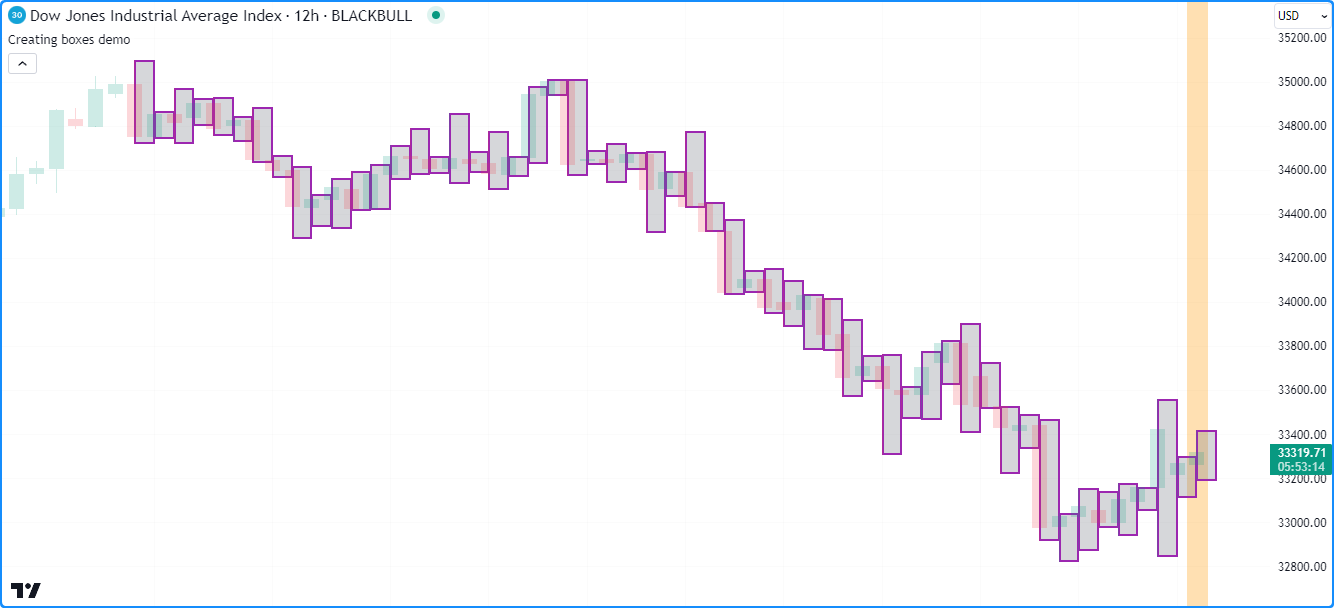
Let’s write a simple script to display boxes on a chart. The example below draws a box projecting each bar’s high and low values from the horizontal center of the current bar to the center of the next available bar.
On each bar, the script creates topLeft and bottomRight points via
chart.point.now() and
chart.point_from_index(), then
calls box.new() to construct a new box and
display it on the chart. It also highlights the background on the unconfirmed chart bar using
bgcolor() to indicate that it redraws that
box until the bar’s last update:
//@version=5
indicator("Creating boxes demo", overlay = true)

//@variable The `chart.point` for the top-left corner of the box. Contains `index` and `time` information.
topLeft = chart.point.now(high)
//@variable The `chart.point` for the bottom-right corner of the box. Does not contain `time` information.
bottomRight = chart.point.from_index(bar_index + 1, low)

// Draw a box using the `topLeft` and `bottomRight` corner points. Uses the `index` fields as x-coordinates.
box.new(topLeft, bottomRight, color.purple, 2, bgcolor = color.new(color.gray, 70))

// Color the background on the unconfirmed bar.
bgcolor(barstate.isconfirmed ? na : color.new(color.orange, 70), title = "Unconfirmed bar highlight")
- Note that:
- The
bottomRightpoint’sindexfield is one bar greater than theindexin thetopLeft. If the x-coordinates of the corners were equal, the script would draw a vertical line at the horizontal center of each bar, resembling the example in this page’s Creating lines section. - Similar to lines, if the
topLeftandbottomRightcontained identical coordinates, the box wouldn’t display on the chart since there would be no space between them to draw. However, its ID would still exist. - This script only displays approximately the last 50 boxes on the chart, as we have not specified a
max_boxes_countin the indicator() function call.
- The
Modifying boxes
Multiple setter functions exist in the box.* namespace, allowing scripts to modify the
properties of box objects:
- box.set_top_left_point() and
box.set_bottom_right_point()
respectively update the top-left and bottom-right coordinates of the
idbox using information from the specifiedpoint. - box.set_left() and
box.set_right() set the left or right
x-coordinate of the
idbox to a newleft/rightvalue, which can be a bar index or time value depending on the box’sxlocproperty. - box.set_top() and
box.set_bottom() set the top or bottom
y-coordinate of the
idbox to a newtop/bottomvalue. - box.set_lefttop() sets the
leftandtopcoordinates of theidbox, and box.set_rightbottom() sets itsrightandbottomcoordinates. - box.set_border_color(),
box.set_border_width() and
box.set_border_style() respectively update
the
color,width, andstyleof theidbox’s border. - box.set_extend() sets the horizontal
extendproperty of theidbox. - box.set_bgcolor() sets the color of the space inside
the
idbox to a newcolor. - box.set_text(),
box.set_text_size(),
box.set_text_color(),
box.set_text_halign(),
box.set_text_valign(),
box.set_text_wrap(), and
box.set_text_font_family()
update the
idbox’s text-related properties.
As with setter functions in the line.* namespace, all box setters modify the id box directly without
returning a value, and each setter function accepts “series” arguments.
Note that, unlike lines, the box.* namespace does not contain a setter
function to modify a box’s xloc. Users must create a new
box with the desired xloc setting for such cases.
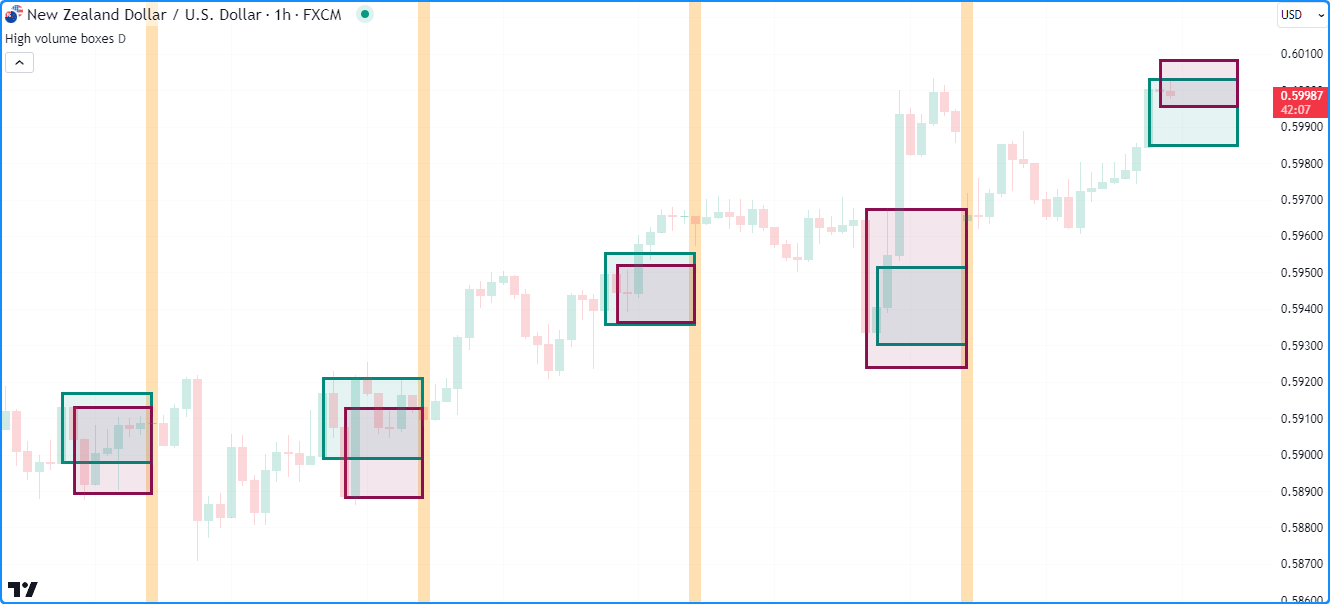
This example uses boxes to visualize the ranges of upward and downward bars with the highest
volume over a user-defined timeframe.
When the script detects a change
in the timeframe, it assigns new boxes
to its upBox and downBox variables, resets its upVolume and downVolume values, and highlights the
chart background.
When an upward or downward bar’s volume
exceeds the upVolume or downVolume, the script updates the volume-tracking variables and calls
box.set_top_left_point() and
box.set_bottom_right_point() to update the
upBox or downBox coordinates. The setters use the information from the chart points
created with chart.point.now() and
chart.point.from_time() to project that bar’s
high and
low values from the current time to the
closing time of the timeframe:
//@version=5
indicator("Modifying boxes demo", "High volume boxes", true, max_boxes_count = 100)

//@variable The timeframe of the calculation.
string timeframe = input.timeframe("D", "Timeframe")

//@variable A box projecting the range of the upward bar with the highest `volume` over the `timeframe`.
var box upBox = na
//@variable A box projecting the range of the downward bar with the lowest `volume` over the `timeframe`.
var box downBox = na
//@variable The highest volume of upward bars over the `timeframe`.
var float upVolume = na
//@variable The highest volume of downward bars over the `timeframe`.
var float downVolume = na

// Color variables.
var color upBorder   = color.teal
var color upFill     = color.new(color.teal, 90)
var color downBorder = color.maroon
var color downFill   = color.new(color.maroon, 90)

//@variable The closing time of the `timeframe`.
int closeTime = time_close(timeframe)
//@variable Is `true` when a new bar starts on the `timeframe`.
bool changeTF = timeframe.change(timeframe)

//@variable The `chart.point` for the top-left corner of the boxes. Contains `index` and `time` information.
topLeft = chart.point.now(high)
//@variable The `chart.point` for the bottom-right corner of the boxes. Does not contain `index` information.
bottomRight = chart.point.from_time(closeTime, low)

if changeTF and not na(volume)
    if close > open
        // Update `upVolume` and `downVolume` values.
        upVolume   := volume
        downVolume := 0.0
        // Draw a new `upBox` using `time` and `price` info from the `topLeft` and `bottomRight` points.
        upBox := box.new(topLeft, bottomRight, upBorder, 3, xloc = xloc.bar_time, bgcolor = upFill)
        // Draw a new `downBox` with `na` coordinates.
        downBox := box.new(na, na, na, na, downBorder, 3, xloc = xloc.bar_time, bgcolor = downFill)
    else
        // Update `upVolume` and `downVolume` values.
        upVolume   := 0.0
        downVolume := volume
        // Draw a new `upBox` with `na` coordinates.
        upBox := box.new(na, na, na, na, upBorder, 3, xloc = xloc.bar_time, bgcolor = upFill)
        // Draw a new `downBox` using `time` and `price` info from the `topLeft` and `bottomRight` points.
        downBox := box.new(topLeft, bottomRight, downBorder, 3, xloc = xloc.bar_time, bgcolor = downFill)
// Update the ``upVolume`` and change the ``upBox`` coordinates when volume increases on an upward bar.
else if close > open and volume > upVolume
    upVolume := volume
    box.set_top_left_point(upBox, topLeft)
    box.set_bottom_right_point(upBox, bottomRight)
// Update the ``downVolume`` and change the ``downBox`` coordinates when volume increases on a downward bar.
else if close <= open and volume > downVolume
    downVolume := volume
    box.set_top_left_point(downBox, topLeft)
    box.set_bottom_right_point(downBox, bottomRight)

// Highlight the background when a new `timeframe` bar starts.
bgcolor(changeTF ? color.new(color.orange, 70) : na, title = "Timeframe change highlight")
- Note that:
- The indicator() function call
contains
max_boxes_count = 100, meaning the script will preserve the last 100 boxes on the chart. - We utilized both overloads of box.new() in this example.
On the first bar of the
timeframe, the script calls the first overload for theupBoxwhen the bar is rising, and it calls that overload for thedownBoxwhen the bar is falling. It uses the second overload to assign a new box with na values to the other box variable on that bar.
- The indicator() function call
contains
Box styles
Users can include one of the following line.style_* variables in their
box.new() or
box.set_border_style()
function calls to set the border styles of boxes drawn by their scripts:
| Argument | Box |
|---|---|
line.style_solid |
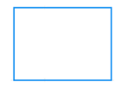 |
line.style_dotted |
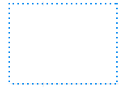 |
line.style_dashed |
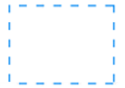 |
Reading box values
The box.* namespace features getter functions that allow scripts to retrieve coordinate values from a box instance:
- box.get_left() and
box.get_right() respectively
get the x-coordinates of the left and right edges of the
idbox. Whether the value returned represents a bar index or time value depends on the box’sxlocproperty. - box.get_top() and
box.get_bottom() respectively
get the top and bottom y-coordinates of the
idbox.
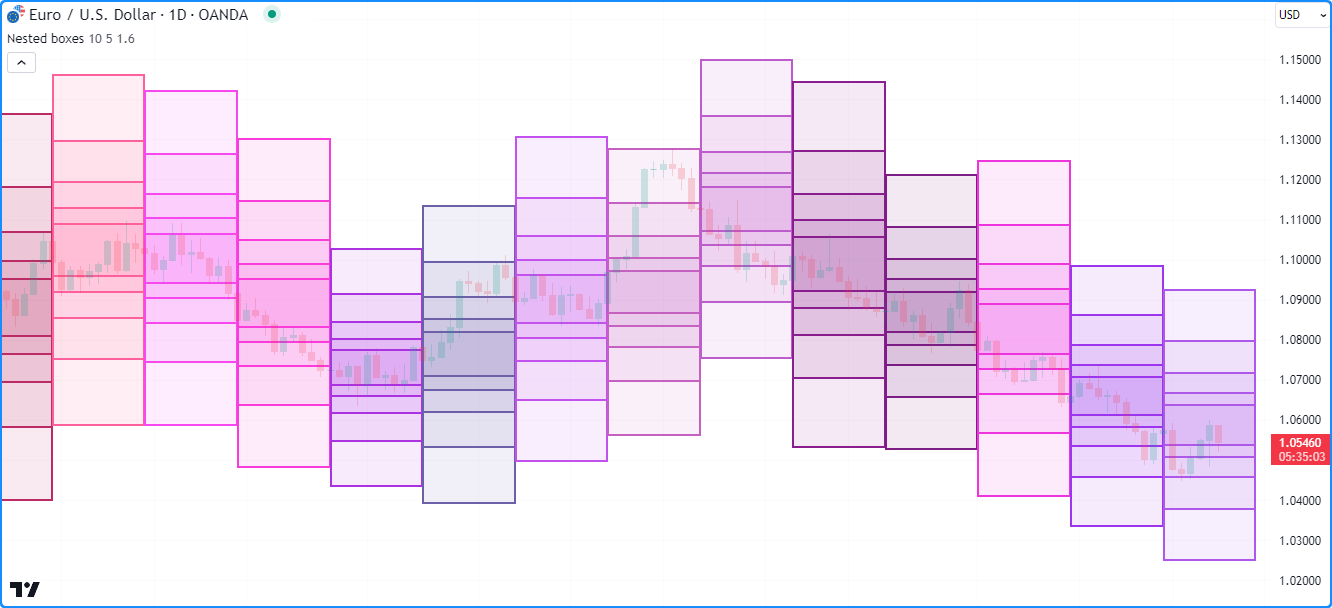
The example below draws boxes to visualize hypothetical price ranges over a period of length bars.
At the start of each new period, it uses the average candle range multiplied by the scaleFactor input
to calculate the corner points of a box centered at the hl2
price with an initialRange height. After drawing the first box, it creates numberOfBoxes - 1 new boxes inside a
for loop.
Within each loop iteration, the script gets the lastBoxDrawn by retrieving the
last element from the read-only
box.all array, then calls
box.get_top() and
box.get_bottom() to get its
y-coordinates. It uses these values to calculate the coordinates for a new box that’s scaleFactor times
taller than the previous:
//@version=5
indicator("Reading box values demo", "Nested boxes", overlay = true, max_boxes_count = 500)

//@variable The number of bars in the range calculation.
int length = input.int(10, "Length", 2, 500)
//@variable The number of nested boxes drawn on each period.
int numberOfBoxes = input.int(5, "Nested box count", 1)
//@variable The scale factor applied to each box.
float scaleFactor = input.float(1.6, "Scale factor", 1)

//@variable The initial box range.
float initialRange = scaleFactor * ta.sma(high - low, length)

if bar_index % length == 0
    //@variable The top-left `chart.point` for the initial box. Does not contain `time` information.
    topLeft = chart.point.from_index(bar_index, hl2 + initialRange / 2)
    //@variable The bottom-right `chart.point` for the initial box. Does not contain `time` information.
    bottomRight = chart.point.from_index(bar_index + length, hl2 - initialRange / 2)

    // Calculate border and fill colors of the boxes.
    borderColor = color.rgb(math.random(100, 255), math.random(0, 100), math.random(100, 255))
    bgColor = color.new(borderColor, math.max(100 * (1 - 1/numberOfBoxes), 90))

    // Draw a new box using the `topLeft` and `bottomRight` points. Uses their `index` fields as x-coordinates.
    box.new(topLeft, bottomRight, borderColor, 2, bgcolor = bgColor)

    if numberOfBoxes > 1
        // Loop to create additional boxes.
        for i = 1 to numberOfBoxes - 1
            //@variable The last box drawn by the script.
            box lastBoxDrawn = box.all.last()

            //@variable The top price of the last box.
            float top = box.get_top(lastBoxDrawn)
            //@variable The bottom price of the last box.
            float bottom = box.get_bottom(lastBoxDrawn)

            //@variable The scaled range of the new box.
            float newRange = scaleFactor * (top - bottom) * 0.5

            // Update the `price` fields of the `topLeft` and `bottomRight` points.
            // This does not affect the coordinates of previous boxes.
            topLeft.price     := hl2 + newRange
            bottomRight.price := hl2 - newRange

            // Draw a new box using the updated `topLeft` and `bottomRight` points.
            box.new(topLeft, bottomRight, borderColor, 2, bgcolor = bgColor)
- Note that:
- The indicator() function call uses
max_boxes_count = 500, meaning the script can display up to 500 boxes on the chart. - Each drawing has a
rightindexlengthbars beyond theleftindex. Since the x-coordinates of these drawings can be up to 500 bars into the future, we’ve set themaxvalof thelengthinput to 500. - On each new period, the script uses randomized color.rgb()
values for the
border_colorandbgcolorof the boxes. - Each box.new() call copies the coordinates from the
chart.point objects assigned to the
topLeftandbottomRightvariables, which is why the script can modify theirpricefields on each loop iteration without affecting the other boxes.
- The indicator() function call uses
Cloning boxes
To clone a specific box id, use box.copy().
This function copies the box and its properties. Any changes to the copied box do not affect the original.
For example, this script declares an originalBox variable on the first bar and assigns a
new box to it once every length bars.
On other bars, it uses box.copy() to create
a copiedBox and calls box.set_*() functions to modify its
properties. As shown on the chart below, these changes do not modify the originalBox:
//@version=5
indicator("Cloning boxes demo", overlay = true, max_boxes_count = 500)

//@variable The number of bars between each new mainLine assignment.
int length = input.int(20, "Length", 2)

//@variable The `chart.point` for the top-left of the `originalBox`. Contains `time` and `index` information.
topLeft = chart.point.now(high)
//@variable The `chart.point` for the bottom-right of the `originalBox`. Does not contain `time` information.
bottomRight = chart.point.from_index(bar_index + 1, low)

//@variable A new box with `topLeft` and `bottomRight` corners on every `length` bars.
var box originalBox = na

//@variable Is teal when the bar is rising, maroon when it's falling.
color originalColor = close > open ? color.teal : color.maroon

if bar_index % length == 0
    // Assign a new box using the `topLeft` and `bottomRight` info to the `originalBox`.
    // This box uses the `index` fields from the points as x-coordinates.
    originalBox := box.new(topLeft, bottomRight, originalColor, 2, bgcolor = color.new(originalColor, 60))
else
    //@variable A clone of the `originalBox`.
    box copiedBox = box.copy(originalBox)
    // Modify the `copiedBox`. These changes do not affect the `originalBox`.
    box.set_top(copiedBox, high)
    box.set_bottom_right_point(copiedBox, bottomRight)
    box.set_border_color(copiedBox, color.gray)
    box.set_border_width(copiedBox, 1)
    box.set_bgcolor(copiedBox, na)
Deleting boxes
To delete boxes drawn by a script, use box.delete().
As with *.delete() functions in other drawing namespaces, this function is handy for conditionally
removing boxes or maintaining a specific number of boxes on the chart.
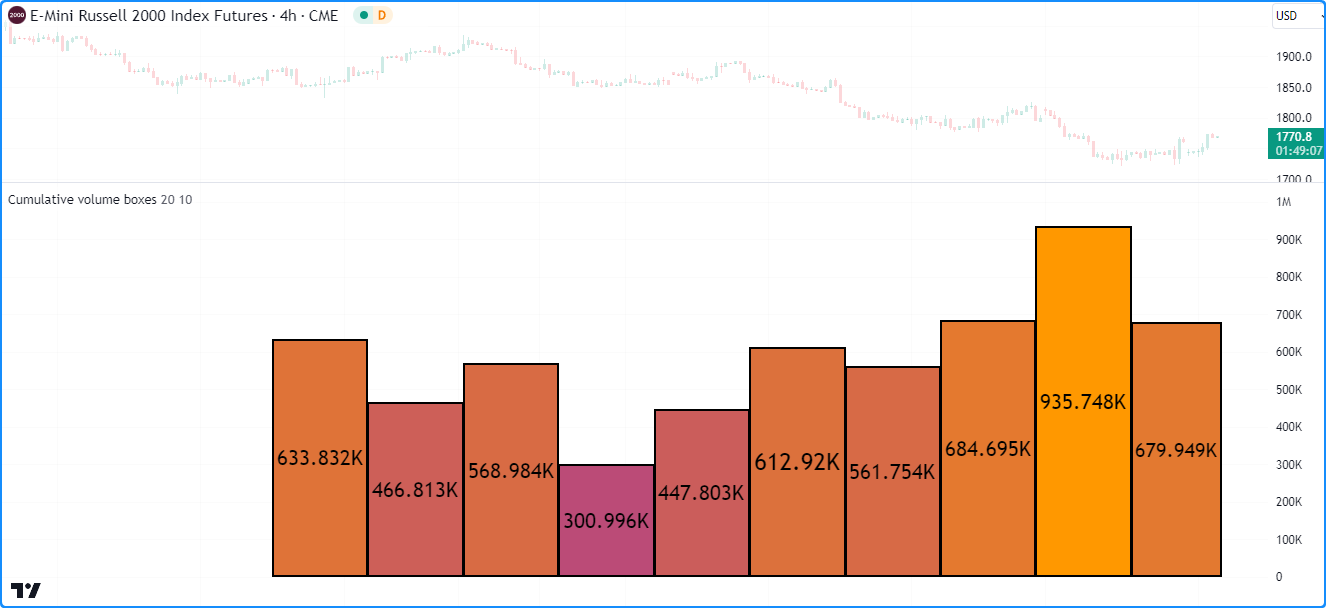
This example displays boxes representing periodic cumulative volume values. The script
creates a new box ID and stores it in a boxes
array once every length bars. If the array’s size
exceeds the specified numberOfBoxes, the script removes the oldest box from the array using
array.shift() and
deletes it using box.delete().
On other bars, it accumulates volume
over each period by modifying the top of the
last box in the boxes array.
The script then uses for loops to find the highestTop of all the array’s boxes and set the
bgcolor of each box with a gradient color
based on its box.get_top()
value relative to the highestTop:
//@version=5

//@variable The maximum number of boxes to show on the chart.
const int MAX_BOXES_COUNT = 500

indicator("Deleting boxes demo", "Cumulative volume boxes", format = format.volume, max_boxes_count = MAX_BOXES_COUNT)

//@variable The number of bars in each period.
int length = input.int(20, "Length", 1)
//@variable The maximum number of volume boxes in the calculation.
int numberOfBoxes = input.int(10, "Number of boxes", 1, MAX_BOXES_COUNT)

//@variable An array containing the ID of each box displayed by the script.
var boxes = array.new<box>()

if bar_index % length == 0
    // Push a new box into the `boxes` array. The box has the default `xloc.bar_index` property.
    boxes.push(box.new(bar_index, 0, bar_index + 1, 0, #000000, 2, text_color = #000000))
    // Shift the oldest box out of the array and delete it when the array's size exceeds the `numberOfBoxes`.
    if boxes.size() > numberOfBoxes
        box.delete(boxes.shift())

//@variable The last box drawn by the script as of the current chart bar.
box lastBox = boxes.last()
// Add the current bar's volume to the top of the `lastBox` and update the `right` index.
lastBox.set_top(lastBox.get_top() + volume)
lastBox.set_right(bar_index + 1)
// Display the top of the `lastBox` as volume-formatted text.
lastBox.set_text(str.tostring(lastBox.get_top(), format.volume))

//@variable The highest `top` of all boxes in the `boxes` array.
float highestTop = 0.0
for id in boxes
    highestTop := math.max(id.get_top(), highestTop)

// Set the `bgcolor` of each `id` in `boxes` with a gradient based on the ratio of its `top` to the `highestTop`.
for id in boxes
    id.set_bgcolor(color.from_gradient(id.get_top() / highestTop, 0, 1, color.purple, color.orange))
- Note that:
- At the top of the code, we’ve declared a
MAX_BOXES_COUNTvariable with the “const int” qualified type. We use this value as themax_boxes_countin the indicator() function and the maximum possible value of thenumberOfBoxesinput. - This script uses the second overload of the box.new() function,
which specifies the box’s
left,top,right, andbottomcoordinates separately. - We’ve included format.volume
as the
formatargument in the indicator() call, which tells the script that the y-axis of the chart pane represents volume values. Each box also displays its top value as volume-formatted text.
- At the top of the code, we’ve declared a
Polylines
Pine Script™ polylines are advanced drawings that sequentially connect the coordinates from an array of chart.point instances using straight or curved line segments.
These powerful drawings can connect up to 10,000 points at any available location on the chart, allowing scripts to draw custom series, polygons, and other complex geometric formations that are otherwise difficult or impossible to draw using line or box objects.
The polyline.* namespace features the following built-ins for creating and managing
polyline objects:
- The polyline.new() function creates a new polyline instance.
- The polyline.delete() function deletes an existing polyline instance.
- The polyline.all variable
references a read-only array containing
the IDs of all polylines displayed by the script. The array’s
size depends on the
max_polylines_countof the indicator() or strategy() declaration statement and the number of polylines drawn by the script.
Unlike lines or boxes, polylines do not have functions for modification or reading their properties. To redraw a polyline on the chart, one can delete the existing instance and create a new polyline with the desired changes.
Creating polylines
The polyline.new() function creates a new polyline instance to display on the chart. It has the following signature:
polyline.new(points, curved, closed, xloc, line_color, fill_color, line_style, line_width) → series polyline
The following eight parameters affect the behavior of a polyline drawing:
points- Accepts an array of
chart.point
objects that determine the coordinates of each point in the polyline. The drawing connects
the coordinates from each element in the array
sequentially, starting from the first. Whether the polyline uses the
indexortimefield from each chart point for its x-coordinates depends on thexlocvalue in the function call. curved- Specifies whether the drawing uses curved line segments to connect each
chart.point in
the
pointsarray. The default value isfalse, meaning it uses straight line segments. closed- Controls whether the polyline will connect the last
chart.point in
the
pointsarray to the first, forming a closed polyline. The default value isfalse. xloc- Specifies which field from each chart.point
in the
pointsarray the polyline uses for its x-coordinates. When its value is xloc.bar_index, the function uses theindexfields to create the polyline. When its value is xloc.bar_time, the function uses thetimefields. The default value is xloc.bar_index. line_color- Specifies the color of all line segments in the polyline drawing. The default is
color.blue. fill_color- Controls the color of the closed space filled by the polyline drawing. Its default value is na.
line_style- Specifies the style of the polyline, which can be any of the available options in the Line styles section of this page. The default is line.style_solid.
line_width- Specifies the width of the polyline, in pixels. The default value is 1.
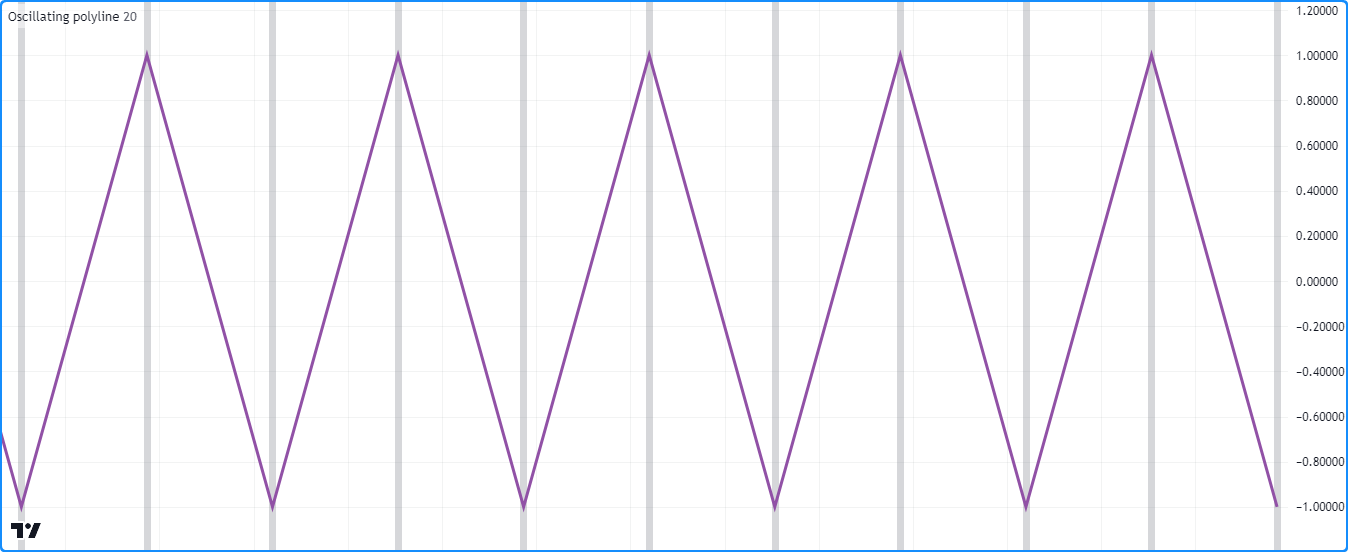
This script demonstrates a simple example of drawing a polyline on the chart.
It pushes a new
chart.point with an
alternating price value into a points array and colors the background with
bgcolor() once every length bars.
On the last confirmed historical bar, the script draws a new polyline on the chart, connecting the coordinates from each chart point in the array, starting from the first:
//@version=5
indicator("Creating polylines demo", "Oscillating polyline")

//@variable The number of bars between each point in the drawing.
int length = input.int(20, "Length between points", 2)

//@variable An array of `chart.point` objects to sequentially connect with a polyline.
var points = array.new<chart.point>()

//@variable The y-coordinate of each point in the `points`. Alternates between 1 and -1 on each `newPoint`.
var int yValue = 1

//@variable Is `true` once every `length` bars, `false` otherwise.
bool newPoint = bar_index % length == 0

if newPoint
    // Push a new `chart.point` into the `points`. The new point contains `time` and `index` info.
    points.push(chart.point.now(yValue))
    // Change the sign of the `yValue`.
    yValue *= -1

// Draw a new `polyline` on the last confirmed historical chart bar.
// The polyline uses the `time` field from each `chart.point` in the `points` array as x-coordinates.
if barstate.islastconfirmedhistory
    polyline.new(points, xloc = xloc.bar_time, line_color = #9151A6, line_width = 3)

// Highlight the chart background on every `newPoint` condition.
bgcolor(newPoint ? color.new(color.gray, 70) : na, title = "New point highlight")
- Note that:
- This script uses only one polyline to connect each chart point from the array with straight line segments, and this drawing spans throughout the available chart data, starting from the first bar.
- While one can achieve a similar effect using lines, doing so would require a new
line instance on each occurrence of the
newPointcondition, and such a drawing would be limited to a maximum of 500 line segments. This single unclosed polyline drawing, on the other hand, can contain up to 9,999 line segments.
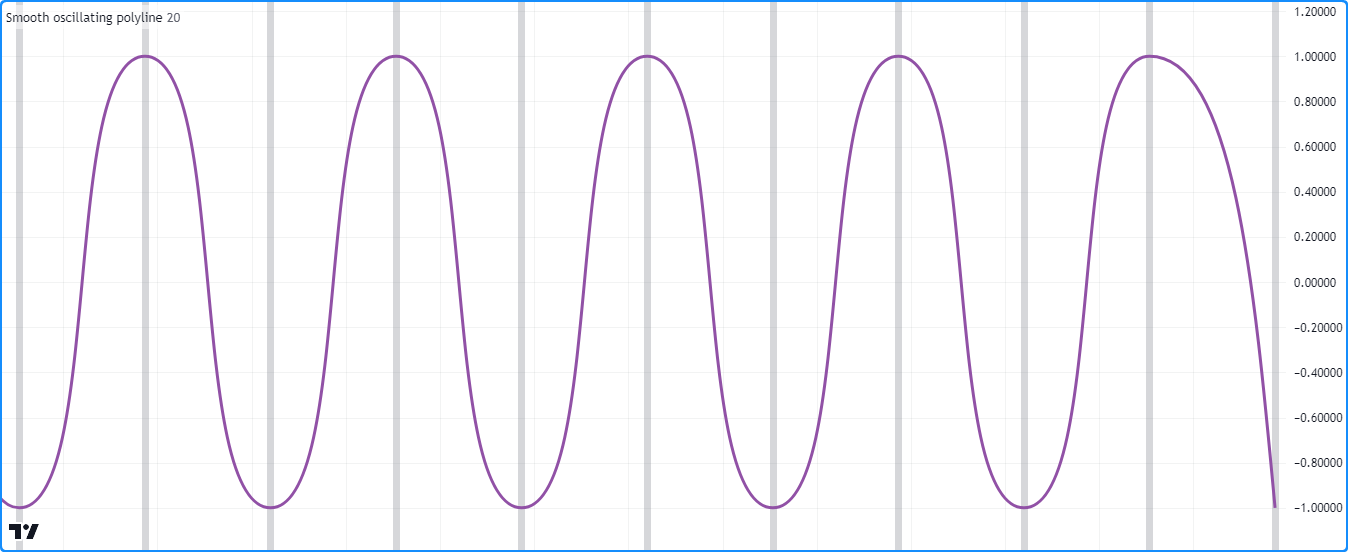
Curved drawings
Polylines can draw curves that are otherwise impossible to produce with lines
or boxes. When enabling the curved parameter of the
polyline.new() function,
the resulting polyline interpolates nonlinear values between the coordinates from each
chart.point in its
array of points to generate a curvy effect.
For instance, the “Oscillating polyline” script in our previous example uses straight line segments to produce
a drawing resembling a triangle wave, meaning a waveform that zig-zags between its peaks and valleys. If we set the
curved parameter in the polyline.new()
call from that example to true, the resulting drawing would connect the points using curved segments,
producing a smooth, nonlinear shape similar to a sine wave:
//@version=5
indicator("Curved drawings demo", "Smooth oscillating polyline")

//@variable The number of bars between each point in the drawing.
int length = input.int(20, "Length between points", 2)

//@variable An array of `chart.point` objects to sequentially connect with a polyline.
var points = array.new<chart.point>()

//@variable The y-coordinate of each point in the `points`. Alternates between 1 and -1 on each `newPoint`.
var int yValue = 1

//@variable Is `true` once every `length` bars, `false` otherwise.
bool newPoint = bar_index % length == 0

if newPoint
    // Push a new `chart.point` into the `points`. The new point contains `time` and `index` info.
    points.push(chart.point.now(yValue))
    // Change the sign of the `yValue`.
    yValue *= -1

// Draw a new curved `polyline` on the last confirmed historical chart bar.
// The polyline uses the `time` field from each `chart.point` in the `points` array as x-coordinates.
if barstate.islastconfirmedhistory
    polyline.new(points, curved = true, xloc = xloc.bar_time, line_color = #9151A6, line_width = 3)

// Highlight the chart background on every `newPoint` condition.
bgcolor(newPoint ? color.new(color.gray, 70) : na, title = "New point highlight")
Notice that in this example, the smooth curves have relatively consistent behavior, and no portion of the drawing extends past its defined coordinates, which is not always the case when drawing curved polylines. The data used to construct a polyline heavily impacts the smooth, piecewise function it interpolates between its points. In some cases, the interpolated curve can reach beyond its actual coordinates.
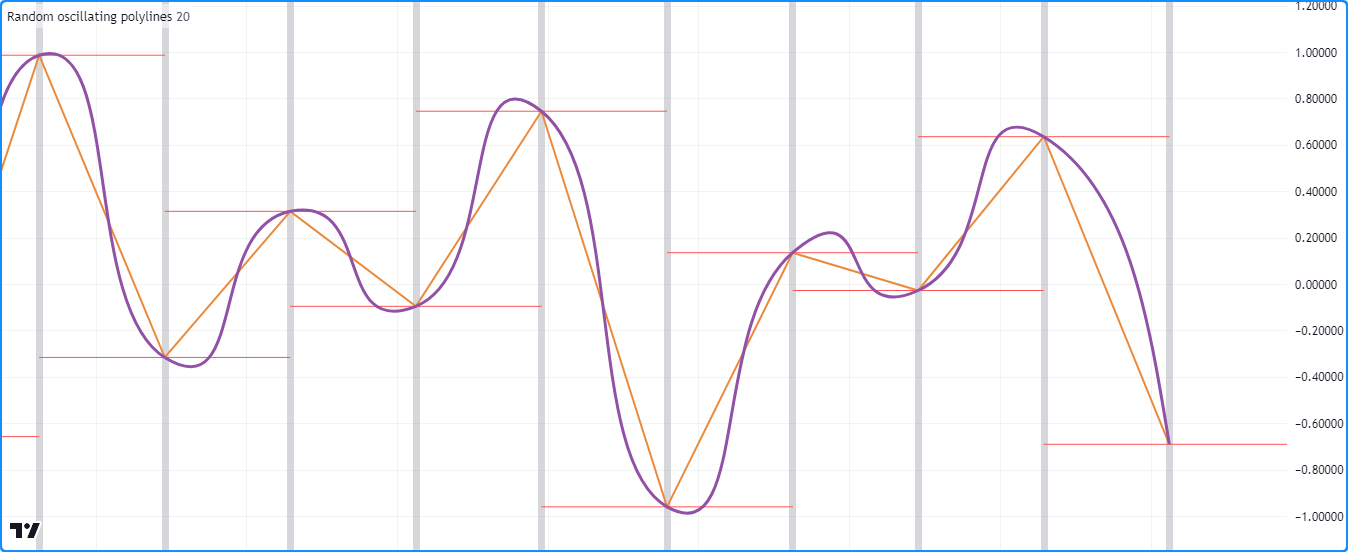
Let’s add some variation to the chart points in our example’s points array
to demonstrate this behavior. In the version below, the script multiplies the yValue by a
random value in the
chart.point.now() calls.
To visualize the behavior, this script also creates a horizontal line
at the price value from each chart.point
in the points array, and it displays another polyline connecting the same points with straight line segments.
As we see on the chart, both polylines pass through all coordinates from the points array. However, the curvy polyline
occasionally reaches beyond the vertical boundaries indicated by the horizontal lines,
whereas the polyline drawn using straight segments does not:
//@version=5
indicator("Curved drawings demo", "Random oscillating polylines")

//@variable The number of bars between each point in the drawing.
int length = input.int(20, "Length between points", 2)

//@variable An array of `chart.point` objects to sequentially connect with a polyline.
var points = array.new<chart.point>()

//@variable The sign of each `price` in the `points`. Alternates between 1 and -1 on each `newPoint`.
var int yValue = 1

//@variable Is `true` once every `length` bars.
bool newPoint = bar_index % length == 0

if newPoint
    // Push a new `chart.point` with a randomized `price` into the `points`.
    // The new point contains `time` and `index` info.
    points.push(chart.point.now(yValue * math.random()))
    // Change the sign of the `yValue`.
    yValue *= -1

    //@variable The newest `chart.point`.
    lastPoint = points.last()
    // Draw a horizontal line at the `lastPoint.price`. This line uses the default `xloc.bar_index`.
    line.new(lastPoint.index - length, lastPoint.price, lastPoint.index + length, lastPoint.price, color = color.red)

// Draw two `polyline` instances on the last confirmed chart bar.
// Both polylines use the `time` field from each `chart.point` in the `points` array as x-coordinates.
if barstate.islastconfirmedhistory
    polyline.new(points, curved = false, xloc = xloc.bar_time, line_color = #EB8A3B, line_width = 2)
    polyline.new(points, curved = true, xloc = xloc.bar_time, line_color = #9151A6, line_width = 3)

// Highlight the chart background on every `newPoint` condition.
bgcolor(newPoint ? color.new(color.gray, 70) : na, title = "New point highlight")
Closed shapes
Since a single polyline can contain numerous straight or curved line segments, and the closed parameter allows
the drawing to connect the coordinates from the first and last
chart.point in its
array of points, we can use
polylines to draw many different types of closed polygonal shapes.
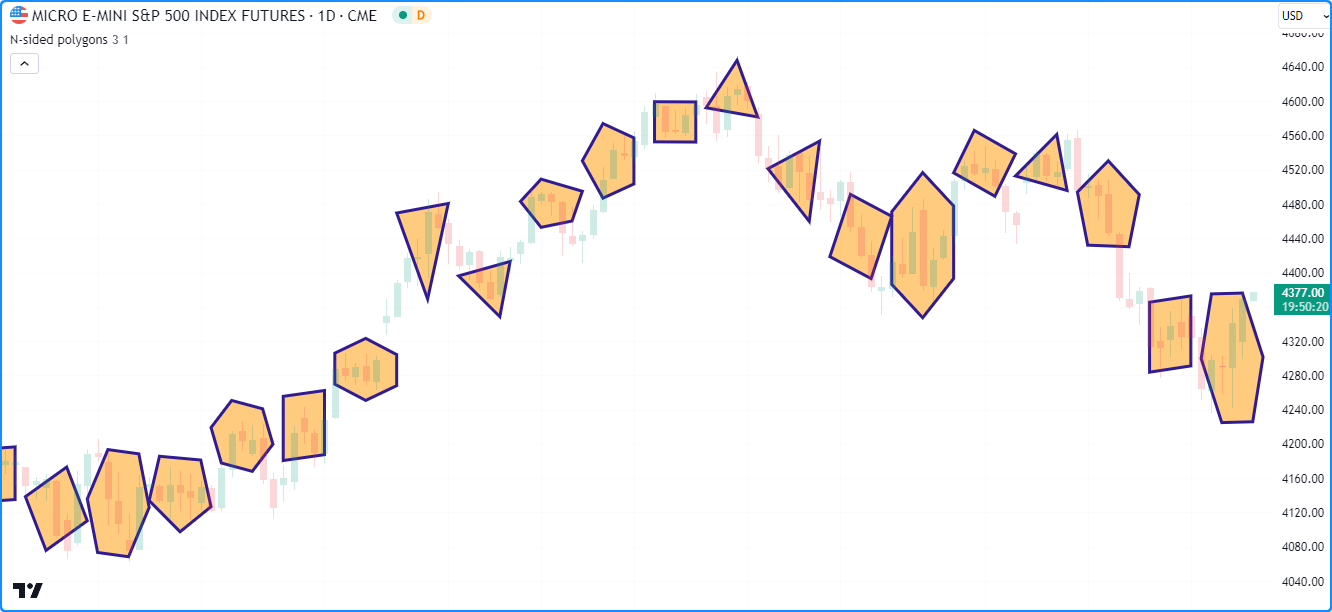
Let’s draw some polygons in Pine. The following script periodically draws randomized polygons centered at hl2 price values.
On each occurrence of the newPolygon condition, it clears
the points array, calculates the numberOfSides and rotationOffset of the new polygon drawing based on
math.random() values, then uses a
for loop to push numberOfSides new chart points into the
array that contain stepped coordinates
from an elliptical path with xScale and yScale semi-axes. The script draws the polygon by connecting each
chart.point
from the points array using a closed polyline with straight line segments:
//@version=5
indicator("Closed shapes demo", "N-sided polygons", true)

//@variable The size of the horizontal semi-axis.
float xScale = input.float(3.0, "X scale", 1.0)
//@variable The size of the vertical semi-axis.
float yScale = input.float(1.0, "Y scale") * ta.atr(2)

//@variable An array of `chart.point` objects containing vertex coordinates.
var points = array.new<chart.point>()

//@variable The condition that triggers a new polygon drawing. Based on the horizontal axis to prevent overlaps.
bool newPolygon = bar_index % int(math.round(2 * xScale)) == 0 and barstate.isconfirmed

if newPolygon
    // Clear the `points` array.
    points.clear()

    //@variable The number of sides and vertices in the new polygon.
    int numberOfSides = int(math.random(3, 7))
    //@variable A random rotation offset applied to the new polygon, in radians.
    float rotationOffset = math.random(0.0, 2.0) * math.pi
    //@variable The size of the angle between each vertex, in radians.
    float step = 2 * math.pi / numberOfSides

    //@variable The counter-clockwise rotation angle of each vertex.
    float angle = rotationOffset

    for i = 1 to numberOfSides
        //@variable The approximate x-coordinate from an ellipse at the `angle`, rounded to the nearest integer.
        int xValue = int(math.round(xScale * math.cos(angle))) + bar_index
        //@variable The y-coordinate from an ellipse at the `angle`.
        float yValue = yScale * math.sin(angle) + hl2

        // Push a new `chart.point` containing the `xValue` and `yValue` into the `points` array.
        // The new point does not contain `time` information.
        points.push(chart.point.from_index(xValue, yValue))
        // Add the `step` to the `angle`.
        angle += step

    // Draw a closed polyline connecting the `points`.
    // The polyline uses the `index` field from each `chart.point` in the `points` array.
    polyline.new(
         points, closed = true, line_color = color.navy, fill_color = color.new(color.orange, 50), line_width = 3
     )
- Note that:
- This example shows the last ~50 polylines on the chart, as we have not specified a
max_polylines_countvalue in the indicator() function call. - The
yScalecalculation multiplies an input.float() by ta.atr(2) to adapt the vertical scale of the drawings to recent price ranges. - The resulting polygons have a maximum width of twice the horizontal semi-axis (
2 * xScale), rounded to the nearest integer. ThenewPolygoncondition uses this value to prevent the polygon drawings from overlapping. - The script rounds the
xValuecalculation to the nearest integer because theindexfield of a chart.point only accepts an int value, as the x-axis of the chart does not include fractional bar indices.
- This example shows the last ~50 polylines on the chart, as we have not specified a
Deleting polylines
To delete a specific polyline id, use
polyline.delete().
This function removes the polyline
object from the script and its drawing on the chart.
As with other drawing objects, we can use polyline.delete() to maintain a specific number of polyline drawings or conditionally remove drawings from a chart.
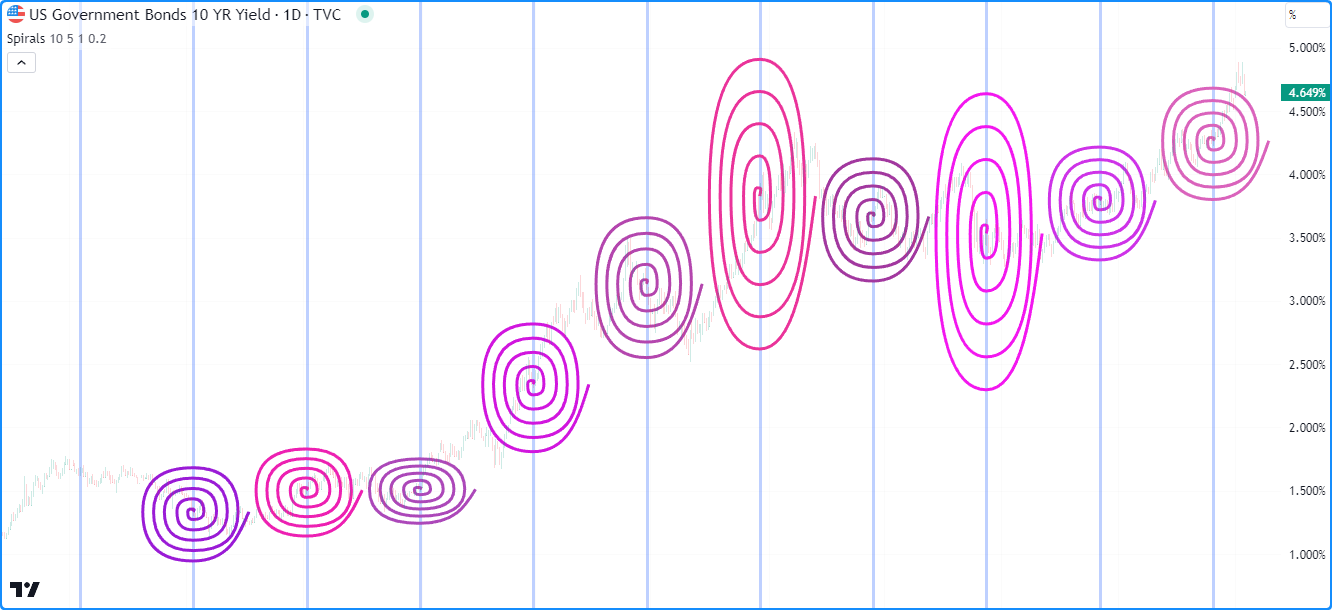
For example, the script below periodically draws approximate arithmetic spirals and stores their polyline IDs in an array, which it uses as a queue to manage the number of drawings it displays.
When the newSpiral condition occurs, the script creates a points array and adds
chart points within a for loop.
On each loop iteration, it calls the spiralPoint() user-defined function
to create a new chart.point containing
stepped values from an elliptical path that grows with respect to the angle. The script then creates a
randomly colored curved polyline connecting the coordinates from the points and
pushes its ID into the polylines array.
When the array’s size
exceeds the specified numberOfSpirals, the script removes the oldest polyline using
array.shift() and deletes the
object using polyline.delete():
//@version=5

//@variable The maximum number of polylines allowed on the chart.
const int MAX_POLYLINES_COUNT = 100

indicator("Deleting polylines example", "Spirals", true, max_polylines_count = MAX_POLYLINES_COUNT)

//@variable The number of spiral drawings on the chart.
int numberOfSpirals = input.int(10, "Spirals shown", 1, MAX_POLYLINES_COUNT)
//@variable The number of full spiral rotations to draw.
int rotations = input.int(5, "Rotations", 1)
//@variable The scale of the horizontal semi-axis.
float xScale = input.float(1.0, "X scale")
//@variable The scale of the vertical semi-axis.
float yScale = input.float(0.2, "Y scale") * ta.atr(2)

//@function Calculates an approximate point from an elliptically-scaled arithmetic spiral.
//@returns  A `chart.point` with `index` and `price` information.
spiralPoint(float angle, int xOffset, float yOffset) =>
    result = chart.point.from_index(
         int(math.round(angle * xScale * math.cos(angle))) + xOffset,
         angle * yScale * math.sin(angle) + yOffset
     )

//@variable An array of polylines.
var polylines = array.new<polyline>()

//@variable The condition to create a new spiral.
bool newSpiral = bar_index % int(math.round(4 * math.pi * rotations * xScale)) == 0

if newSpiral
    //@variable An array of `chart.point` objects for the `spiral` drawing.
    points = array.new<chart.point>()
    //@variable The counter-clockwise angle between calculated points, in radians.
    float step = math.pi / 2
    //@variable The rotation angle of each calculated point on the spiral, in radians.
    float theta = 0.0
    // Loop to create the spiral's points. Creates 4 points per full rotation.
    for i = 0 to rotations * 4
        //@variable A new point on the calculated spiral.
        chart.point newPoint = spiralPoint(theta, bar_index, ohlc4)
        // Add the `newPoint` to the `points` array.
        points.push(newPoint)
        // Add the `step` to the `theta` angle.
        theta += step

    //@variable A random color for the new `spiral` drawing.
    color spiralColor = color.rgb(math.random(150, 255), math.random(0, 100), math.random(150, 255))
    //@variable A new polyline connecting the spiral points. Uses the `index` field from each point as x-coordinates.
    polyline spiral = polyline.new(points, true, line_color = spiralColor, line_width = 3)

    // Push the new `spiral` into the `polylines` array.
    polylines.push(spiral)
    // Shift the first polyline out of the array and delete it when the array's size exceeds the `numberOfSpirals`.
    if polylines.size() > numberOfSpirals
        polyline.delete(polylines.shift())

// Highlight the background when `newSpiral` is `true`.
bgcolor(newSpiral ? color.new(color.blue, 70) : na, title = "New drawing highlight")
- Note that:
- We declared a
MAX_POLYLINES_COUNTglobal variable with a constant value of 100. The script uses this constant as themax_polylines_countvalue in the indicator() function and themaxvalof thenumberOfSpiralsinput. - As with our “N-sided polygons” example in the previous section,
we round the calculation of x-coordinates to the nearest integer since the
indexfield of a chart.point can only accept an int value. - Despite the smooth appearance of the drawings, each polyline’s
pointsarray only contains four chart.point objects per spiral rotation. Since the polyline.new() call includescurved = true, each polyline uses smooth curves to connect theirpoints, producing a visual approximation of the spiral’s actual curvature. - The width of each spiral is approximately
4 * math.pi * rotations * xScale, rounded to the nearest integer. We use this value in thenewSpiralcondition to space each drawing and prevent overlaps.
- We declared a
Redrawing polylines
It may be desirable in some cases to change a polyline drawing throughout a script’s execution.
While the polyline.* namespace does not contain built-in setter functions, we can redraw polylines referenced by
variables or collections by deleting the existing polylines and
assigning new instances with the desired changes.
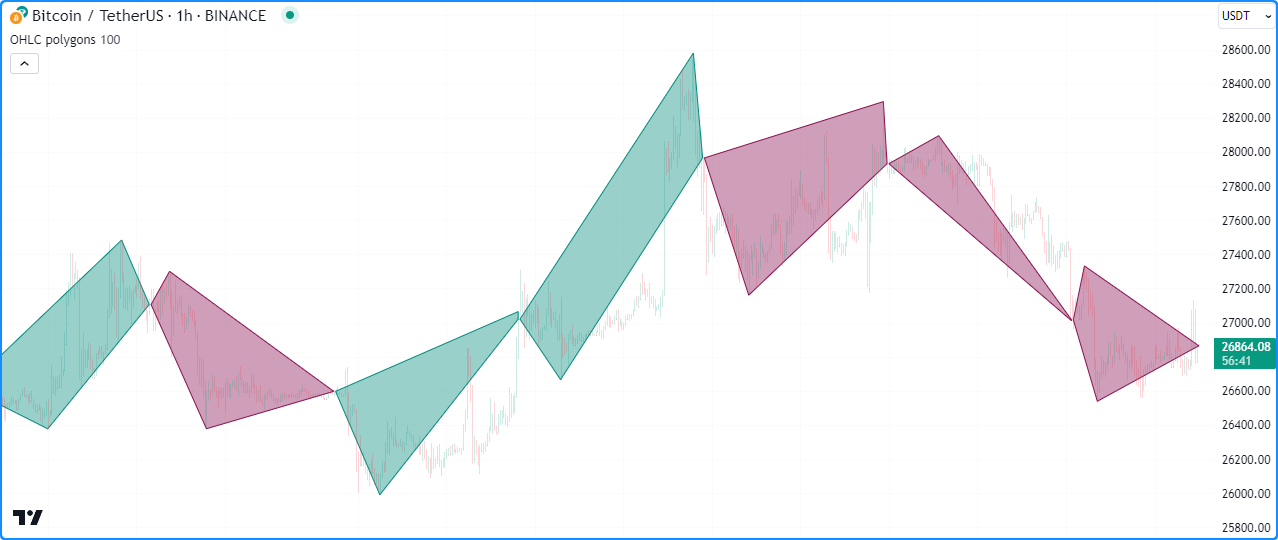
The following example uses polyline.delete() and polyline.new() calls to update the value of a polyline variable.
This script draws closed polylines that connect the open, high, low, and close points of periods containing length bars. It creates a
currentDrawing variable on the first bar and assigns a polyline ID to it on every chart bar. It uses the openPoint,
highPoint, lowPoint, and closePoint variables to reference chart points
that track the period’s developing OHLC values. As new values emerge, the script assigns new
chart.point objects to the variables,
collects them in an array using
array.from, then creates a
new polyline connecting the coordinates from the
array’s points and assigns it to the currentDrawing.
When the newPeriod condition is false (i.e., the current period is not complete), the script
deletes the polyline referenced by the currentDrawing before
creating a new one, resulting in a dynamic drawing that changes
over the developing period:
//@version=5
indicator("Redrawing polylines demo", "OHLC polygons", true, max_polylines_count = 100)

//@variable The length of the period.
int length = input.int(100, "Length", 1)

//@variable A `chart.point` representing the start of each period.
var chart.point openPoint = na
//@variable A `chart.point` representing the highest point of each period.
var chart.point highPoint = na
//@variable A `chart.point` representing the lowest point of each period.
var chart.point lowPoint = na
//@variable A `chart.point` representing the current bar's closing point.
closePoint = chart.point.now(close)

//@variable The current period's polyline drawing.
var polyline currentDrawing = na

//@variable Is `true` once every `length` bars.
bool newPeriod = bar_index % length == 0

if newPeriod
    // Assign new chart points to the `openPoint`, `highPoint`, and `closePoint`.
    openPoint := chart.point.now(open)
    highPoint := chart.point.now(high)
    lowPoint  := chart.point.now(low)
else
    // Assign a new `chart.point` to the `highPoint` when the `high` is greater than its `price`.
    if high > highPoint.price
        highPoint := chart.point.now(high)
    // Assign a new `chart.point` to the `lowPoint` when the `low` is less than its `price`.
    if low < lowPoint.price
        lowPoint := chart.point.now(low)

//@variable Is teal when the `closePoint.price` is greater than the `openPoint.price`, maroon otherwise.
color drawingColor = closePoint.price > openPoint.price ? color.teal : color.maroon

// Delete the polyline assigned to the `currentDrawing` if it's not a `newPeriod`.
if not newPeriod
    polyline.delete(currentDrawing)
// Assign a new polyline to the `currentDrawing`.
// Uses the `index` field from each `chart.point` in its array as x-coordinates.
currentDrawing := polyline.new(
     array.from(openPoint, highPoint, closePoint, lowPoint), closed = true,
     line_color = drawingColor, fill_color = color.new(drawingColor, 60)
 )
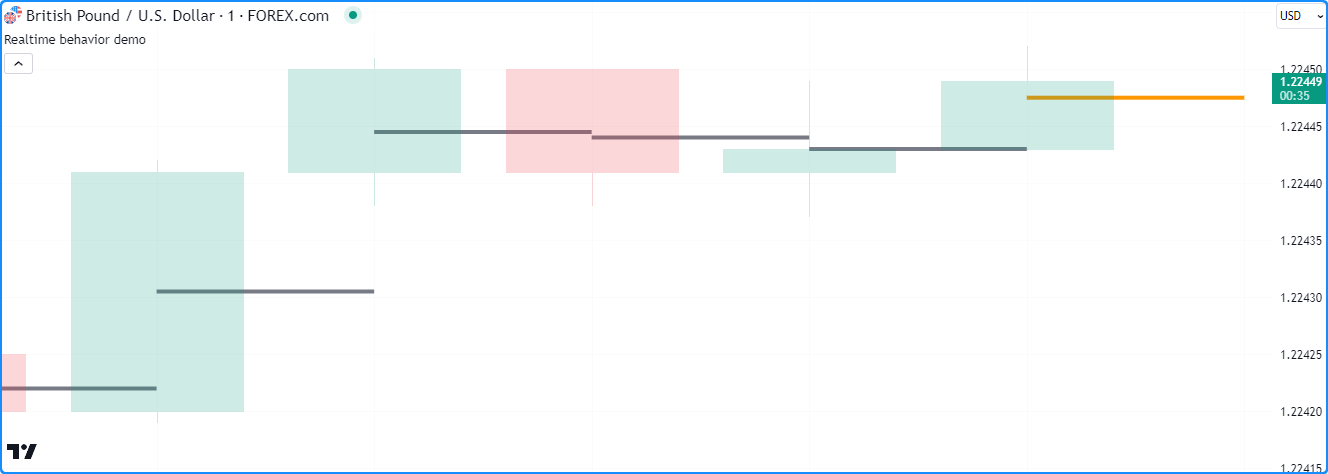
Realtime behavior
Lines, boxes, and polylines are subject to both commit and rollback actions, which affect the behavior of a script when it executes on a realtime bar. See the page on Pine Script™’s Execution model.
This script demonstrates the effect of rollback when it executes on the realtime, unconfirmed chart bar:
//@version=5
indicator("Realtime behavior demo", overlay = true)

//@variable Is orange when the `line` is subject to rollback and gray after the `line` is committed.
color lineColor = barstate.isconfirmed ? color.gray : color.orange

line.new(bar_index, hl2, bar_index + 1, hl2, color = lineColor, width = 4)
The line.new() call in this example creates a new line ID on each iteration when values change on the unconfirmed bar. The script automatically deletes the objects created on each change in that bar because of the rollback before each iteration. It only commits the last line created before the bar closes, and that line instance is the one that persists on the confirmed bar.
Limitations
Total number of objects
Lines, boxes, and polylines consume server resources, which is why there are limits on the total number of drawings per script. When a script creates more drawing objects than the allowed limit, the Pine Script™ runtime automatically deletes the oldest ones in a process referred to as garbage collection.
A single script can contain up to 500 lines, 500 boxes, and 100 polylines. Users can control the garbage collection limits by
specifying the max_lines_count, max_boxes_count, and max_polylines_count values in their script’s
indicator() or
strategy() declaration statement.
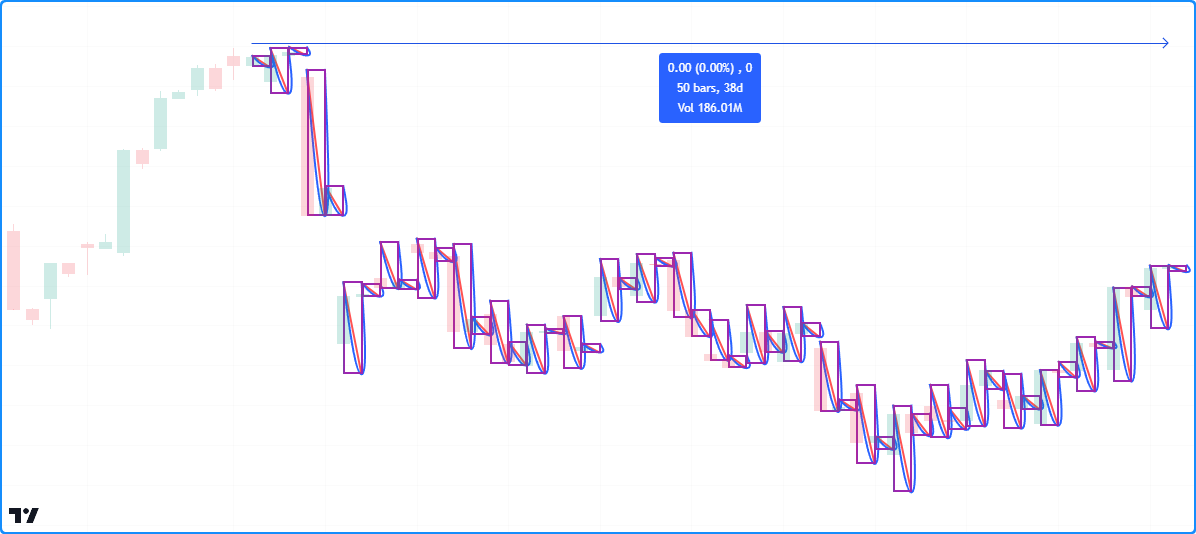
This script demonstrates how garbage collection works in Pine. It creates a new line, box, and polyline on each chart bar.
We haven’t specified values for the max_lines_count, max_boxes_count, or max_polylines_count parameters in the
indicator() function call, so the script will
maintain the most recent ~50 lines, boxes, and polylines on the chart, as this is the default setting for each parameter:
//@version=5
indicator("Garbage collection demo", overlay = true)

//@variable A new `chart.point` at the current `bar_index` and `high`.
firstPoint = chart.point.now(high)
//@variable A new `chart.point` one bar into the future at the current `low`.
secondPoint = chart.point.from_index(bar_index + 1, low)
//@variable A new `chart.point` one bar into the future at the current `high`.
thirdPoint = chart.point.from_index(bar_index + 1, high)

// Draw a new `line` connecting the `firstPoint` to the `secondPoint`.
line.new(firstPoint, secondPoint, color = color.red, width = 2)
// Draw a new `box` with the `firstPoint` top-left corner and `secondPoint` bottom-right corner.
box.new(firstPoint, secondPoint, color.purple, 2, bgcolor = na)
// Draw a new `polyline` connecting the `firstPoint`, `secondPoint`, and `thirdPoint` sequentially.
polyline.new(array.from(firstPoint, secondPoint, thirdPoint), true, line_width = 2)
- Note that:
- We’ve used TradingView’s “Measure” drawing tool to measure the number of bars covered by the script’s drawing objects.
Future references with `xloc.bar_index`
Objects positioned using xloc.bar_index can contain x-coordinates no further than 500 bars into the future.
Other contexts
Scripts cannot use lines, boxes, or
polylines in request.*() functions. Instances of these types can use
the values from request.*() calls, but scripts can only create and draw them in the chart’s context.
This limitation is also why drawing objects will not work when using the timeframe parameter in the
indicator() declaration statement.
Historical buffer and `max_bars_back`
Using barstate.isrealtime in combination with drawings may sometimes produce unexpected results. For example, the intention of this script is to ignore all historical bars and draw horizontal lines spanning 300 bars back on realtime bars:
//@version=5
indicator("Historical buffer demo", overlay = true)

//@variable A `chart.point` at the `bar_index` from 300 bars ago and current `close`.
firstPoint = chart.point.from_index(bar_index[300], close)
//@variable The current bar's `chart.point` containing the current `close`.
secondPoint = chart.point.now(close)

// Draw a new line on realtime bars.
if barstate.isrealtime
    line.new(firstPoint, secondPoint)
However, it will fail at runtime and raise an error. The script fails because it cannot determine the buffer size for historical values of the underlying time series. Although the code doesn’t contain the built-in time variable, the built-in bar_index uses the time series in its inner workings. Therefore, accessing the value of the bar_index from 300 bars back requires the history buffer of the time series to be at least 300 bars.
Pine Script™ includes a mechanism that detects the required historical buffer size automatically in most cases. It works by letting the script access historical values any number of bars back for a limited duration. In this script’s case, using barstate.isrealtime to control the drawing of lines prevents it from accessing the historical series, so it cannot infer the required historical buffer size, and the script fails.
The simple solution to this issue is to use the max_bars_back() function to explicitly define the historical buffer of the time series before evaluating the conditional structure:
//@version=5
indicator("Historical buffer demo", overlay = true)

//@variable A `chart.point` at the `bar_index` from 300 bars ago and current `close.
firstPoint = chart.point.from_index(bar_index[300], close)
//@variable The current bar's `chart.point` containing the current `close`.
secondPoint = chart.point.now(close)

// Explicitly set the historical buffer of the `time` series to 300 bars.
max_bars_back(time, 300)

// Draw a new line on realtime bars.
if barstate.isrealtime
    line.new(firstPoint, secondPoint)
Such issues can be confusing, but they’re quite rare. The Pine Script™ team hopes to eliminate them over time.