Scary BITCOIN-Comparison - 2014 and 2018! You Won't Believe it!!
Cập nhật

Dear Friends <3
D4rkEnergY is back. He will ONCE AGAIN spread love and wisdom to you guys, AND blow your minds!
- Duuhh how stupid you are! We are obviously in an uptrend. How can you believe we ever will go below 5,000 USD?
- You fuxxxxx moron, Bitcoin will MOON right now!
- Idiot, If I'll find you I'm gonna kill you!
- Seriously your TA sucks - and so do your mom!
That is just some of the few comments I have received lately - That is the price you apparently have to pay, when you become Top Author on TradingView, and trying to help people to become better at TA!
But don't worry, guys! It's all good - 99 % of the comments I get are positive, and I seriously just find it funny, how people can react to me making a prediction :)
ANYWAY!
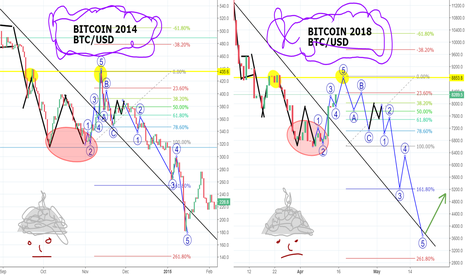
These charts are exact (nothing is edited) comparisons from what happened in 2014, and the situation we are in right now in 2018. It really has some crazy similarities, huh?
The bull run, the lows, double top, double bottom, the sick break out spike and then (maybe a crash back in the downtrend channel)!! With this I want to say 2 things:
1. I'm NOT saying that this will necessarily play out the exact same way, but it's just to tell the disbelievers, that it CAN and MIGHT happen.
2. Even though I'm still bearish so far when it comes to Bitcoin, I'm SUPER bullish LONG TERM - and that is, the most important thing!
D4 Loves you <3
As always - Thanks for all the love and support! And please give this chart a BIG LIKE if you ALSO believe in BITCOIN :)
Ghi chú
Will we really get the crash at 8,8xx USD as we did in 2014? I made some calculations for fun to see, how accurate this is. First of all, we can see that we have the double bottoms at 78,6 % retrace on both charts. It was from here we the bull rally really took off.
In 2014 the price increased with 33 % from the double bottom to the highest point before we had a crash. If we apply that to 2018, it would mean we will now go to 8,8xx USD before the same thing will happen.
Look at the 4 yellow dots. We have the exact same resistance points on both charts.
While we are waiting you better put on your tin foil hats, just in case!!
D4 Loves You! - Please give a like, my friend :)
Thông báo miễn trừ trách nhiệm
Thông tin và ấn phẩm không có nghĩa là và không cấu thành, tài chính, đầu tư, kinh doanh, hoặc các loại lời khuyên hoặc khuyến nghị khác được cung cấp hoặc xác nhận bởi TradingView. Đọc thêm trong Điều khoản sử dụng.
