Bitcoin Bullrun or Pullback for now?
Cập nhật

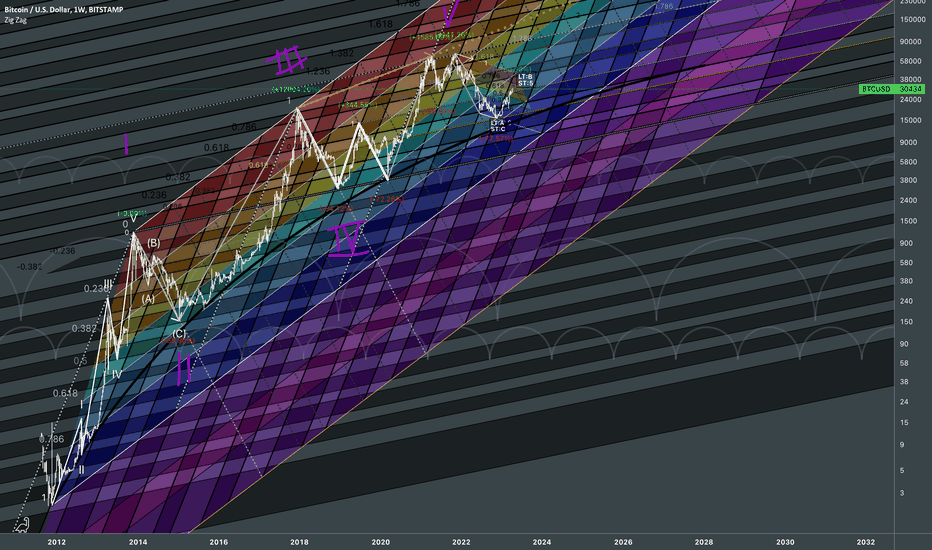
Just a cleaner zoomed in version of Bitcoin Fractal Dimensions II with important visualized details.
Since we've already covered the point of my irregular use of fibonacci channels for simulating the market, it's time to break down the candle data even further to justify whether Fibs are priced in at the right levels.

I'd qualify this as a bullrun if price fails to stop at hot colors or at final red zone for significant correction. If correction is going to be relatively weak, then it would only add "probability points" in favor for a bullrun. Fibonacci itself defines the probability of price movement in Fractal Analysis.

Source for the long-term fibonacci channels:

Since we've already covered the point of my irregular use of fibonacci channels for simulating the market, it's time to break down the candle data even further to justify whether Fibs are priced in at the right levels.
I'd qualify this as a bullrun if price fails to stop at hot colors or at final red zone for significant correction. If correction is going to be relatively weak, then it would only add "probability points" in favor for a bullrun. Fibonacci itself defines the probability of price movement in Fractal Analysis.
Source for the long-term fibonacci channels:

Unlock exclusive tools: fractlab.com
ᴀʟʟ ᴄᴏɴᴛᴇɴᴛ ᴘʀᴏᴠɪᴅᴇᴅ ʙʏ ꜰʀᴀᴄᴛʟᴀʙ ɪꜱ ɪɴᴛᴇɴᴅᴇᴅ ꜰᴏʀ ɪɴꜰᴏʀᴍᴀᴛɪᴏɴᴀʟ ᴀɴᴅ ᴇᴅᴜᴄᴀᴛɪᴏɴᴀʟ ᴘᴜʀᴘᴏꜱᴇꜱ ᴏɴʟʏ.
ᴘᴀꜱᴛ ᴘᴇʀꜰᴏʀᴍᴀɴᴄᴇ ɪꜱ ɴᴏᴛ ɪɴᴅɪᴄᴀᴛɪᴠᴇ ᴏꜰ ꜰᴜᴛᴜʀᴇ ʀᴇꜱᴜʟᴛꜱ.
ᴀʟʟ ᴄᴏɴᴛᴇɴᴛ ᴘʀᴏᴠɪᴅᴇᴅ ʙʏ ꜰʀᴀᴄᴛʟᴀʙ ɪꜱ ɪɴᴛᴇɴᴅᴇᴅ ꜰᴏʀ ɪɴꜰᴏʀᴍᴀᴛɪᴏɴᴀʟ ᴀɴᴅ ᴇᴅᴜᴄᴀᴛɪᴏɴᴀʟ ᴘᴜʀᴘᴏꜱᴇꜱ ᴏɴʟʏ.
ᴘᴀꜱᴛ ᴘᴇʀꜰᴏʀᴍᴀɴᴄᴇ ɪꜱ ɴᴏᴛ ɪɴᴅɪᴄᴀᴛɪᴠᴇ ᴏꜰ ꜰᴜᴛᴜʀᴇ ʀᴇꜱᴜʟᴛꜱ.
Bài đăng liên quan
Thông báo miễn trừ trách nhiệm
Thông tin và ấn phẩm không có nghĩa là và không cấu thành, tài chính, đầu tư, kinh doanh, hoặc các loại lời khuyên hoặc khuyến nghị khác được cung cấp hoặc xác nhận bởi TradingView. Đọc thêm trong Điều khoản sử dụng.