OPEN-SOURCE SCRIPT
Cập nhật Comprehensive Correlation Meter with Multiple Markets
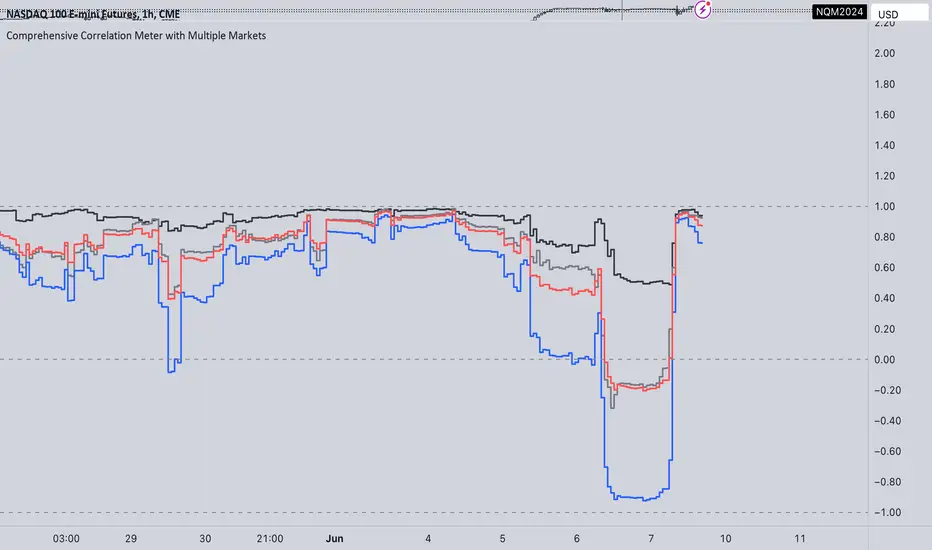
The Comprehensive Correlation Meter is designed to provide traders and investors with insights into the relationships between multiple financial instruments. This script expands upon an existing idea on TradingView about correlation by introducing the ability to analyze the correlation between three markets, offering deeper insights into market relationships. It helps users understand how these markets move in relation to each other, aiding in risk management and portfolio diversification.
Key Features:
Multiple Market Analysis: This script allows you to analyze the correlation between your primary market and two other selected markets.
Customizable Inputs: Users can select any symbols for the reference and third markets, and these selections must be confirmed before use.
Correlation Coefficients: Calculates and plots the correlation coefficients for:
Current Market vs. Reference Market
Third Market vs. Reference Market
Current Market vs. Third Market
An average correlation of all three markets combined.
Visual Aids: Plots reference lines at +1, 0, and -1 to indicate maximum positive correlation, no correlation, and maximum negative correlation.
How It Works:
Input Symbols: Select the symbols for the reference and third markets. The current market is based on the chart you are viewing.
Data Collection: The script collects the closing prices of the selected markets and calculates the percentage changes.
Correlation Calculation: Using the collected data, the script computes the covariance and standard deviations to determine the correlation coefficients.
Visualization: The correlation coefficients and covariances are plotted for visual analysis.
How to Use:
Select Symbols:
Use the input fields to specify the reference and third market symbols. Confirm your selections to proceed.
Customize Display:
Choose whether to display the covariance, reference market, current market, and third market.
Select which correlation coefficients to display.
Interpret Results:
A correlation coefficient close to +1 indicates a strong positive correlation.
A coefficient close to -1 indicates a strong negative correlation.
A coefficient around 0 indicates little to no correlation.
Use these insights to manage risk and diversify your portfolio effectively.
Example Use Case:
Suppose you are trading the S&P 500 and want to understand its correlation with the NASDAQ 100 and a particular stock, such as Apple. By setting the S&P 500 as the reference market, the NASDAQ 100 as the third market, and observing the current market (Apple), you can see how these instruments move in relation to each other. This can help you decide on hedging strategies or identify opportunities for diversification. However this is Not a Financial advise
Phát hành các Ghi chú
The Comprehensive Correlation Meter is designed to provide traders and investors with insights into the relationships between multiple financial instruments. This script expands upon an existing idea on TradingView about correlation by introducing the ability to analyze the correlation between three markets, offering deeper insights into market relationships. It helps users understand how these markets move in relation to each other, aiding in risk management and portfolio diversification.Key Features:
Multiple Market Analysis: This script allows you to analyze the correlation between your primary market and two other selected markets.
Customizable Inputs: Users can select any symbols for the reference and third markets, and these selections must be confirmed before use.
Correlation Coefficients: Calculates and plots the correlation coefficients for:
Current Market vs. Reference Market
Third Market vs. Reference Market
Current Market vs. Third Market
An average correlation of all three markets combined.
Visual Aids: Plots reference lines at +1, 0, and -1 to indicate maximum positive correlation, no correlation, and maximum negative correlation.
Concepts and Methods Used:
This script uses statistical methods to calculate the correlation between different financial instruments. The main components include:
Percentage Change Calculation: The script calculates the percentage change in closing prices for each market. This method helps to normalize the data, making it easier to compare instruments with different price ranges.
Covariance Calculation: Covariance measures how two variables change together. A positive covariance means the variables move in the same direction, while a negative covariance means they move in opposite directions.
Standard Deviation Calculation: Standard deviation measures the amount of variation or dispersion in a set of values. It helps in understanding the volatility of the instruments.
Correlation Coefficient Calculation: The correlation coefficient is derived by dividing the covariance by the product of the standard deviations of the two variables. This results in a value between -1 and +1, indicating the strength and direction of the correlation.
How It Works:
Input Symbols: Select the symbols for the reference and third markets. The current market is based on the chart you are viewing.
Data Collection: The script collects the closing prices of the selected markets and calculates the percentage changes.
Correlation Calculation: Using the collected data, the script computes the covariance and standard deviations to determine the correlation coefficients.
Visualization: The correlation coefficients and covariances are plotted for visual analysis.
How to Use:
Select Symbols:
Use the input fields to specify the reference and third market symbols. Confirm your selections to proceed.
Customize Display:
Choose whether to display the covariance, reference market, current market, and third market.
Select which correlation coefficients to display.
Interpret Results:
A correlation coefficient close to +1 indicates a strong positive correlation.
A coefficient close to -1 indicates a strong negative correlation.
A coefficient around 0 indicates little to no correlation.
Use these insights to manage risk and diversify your portfolio effectively.
Example Use Case:
Suppose you are trading the S&P 500 and want to understand its correlation with the NASDAQ 100 and a particular stock, such as Apple. By setting the S&P 500 as the reference market, the NASDAQ 100 as the third market, and observing the current market (Apple), you can see how these instruments move in relation to each other. This can help you decide on hedging strategies or identify opportunities for diversification.
Applications:
Risk Management: By understanding the correlation between different assets, traders can hedge their positions more effectively.
Portfolio Diversification: Identifying assets with low or negative correlations can help in building a diversified portfolio that minimizes risk.
Market Analysis: Analyzing correlations can provide insights into market conditions and relationships, aiding in strategic decision-making.
Mã nguồn mở
Theo đúng tinh thần TradingView, tác giả của tập lệnh này đã công bố nó dưới dạng mã nguồn mở, để các nhà giao dịch có thể xem xét và xác minh chức năng. Chúc mừng tác giả! Mặc dù bạn có thể sử dụng miễn phí, hãy nhớ rằng việc công bố lại mã phải tuân theo Nội quy.
Thông báo miễn trừ trách nhiệm
Thông tin và các ấn phẩm này không nhằm mục đích, và không cấu thành, lời khuyên hoặc khuyến nghị về tài chính, đầu tư, giao dịch hay các loại khác do TradingView cung cấp hoặc xác nhận. Đọc thêm tại Điều khoản Sử dụng.