OPEN-SOURCE SCRIPT
Relative Normalized Volatility
There are plenty of indicators that aim to measure the volatility (degree of variation) in the price of an instrument, the most well known being the average true range and the rolling standard deviation. Volatility indicators form the key components of most bands and trailing stops indicators, but can also be used to normalize oscillators, they are therefore extremely versatile.
Today proposed indicator aim to compare the estimated volatility of two instruments in order to provide various informations to the user, especially about risk and profitability.
CALCULATION
The relative normalized volatility (RNV) indicator is the ratio between the moving average of the absolute normalized price changes value of two securities, that is:
SMA(|Δ(a)/σ(a)|)
―――――――――――
SMA(|Δ(b)/σ(b)|)
Where a and b are two different securities (note that notation "Δ(x)" refer to the 1st difference of x, and the "||" notation is used to indicate absolute value, for example "|x|" means absolute value of x).
INTERPRETATION
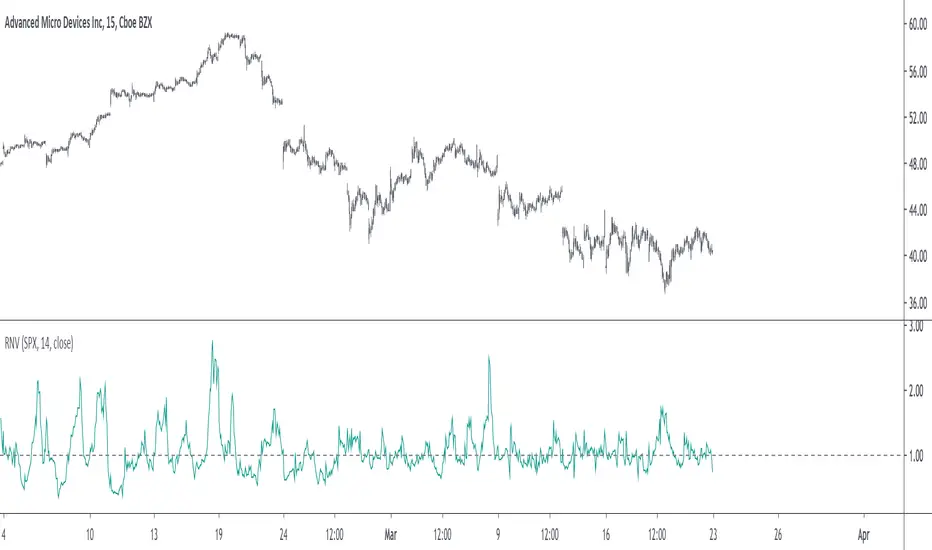
The indicator aim tell us which security is more volatile between a and b, with a value of the indicator greater than 1 indicating that a is on average more volatile than b over the last length period, while a value lower than 1 indicating that the security b is more on average volatile than a.
The indicator use the current symbol as a, while the second security b must be defined in the setting window (by default the S&P500). Risk and profitability are closely related to volatility, as larger price variations could potentially mean larger losses (but also larger gains), therefore a value of the indicator greater than 1 can indicate that it could be more risked (and profitable) to trade security a.

RNV using AMD (top) volatility against Intel (bottom) volatility.

RNV using EURUSD (top) volatility against USDJPY (bottom) volatility.

Larger values of length will make the indicator fluctuate less often around 1. You can also plot the logarithm of the ratio instead in order to have the indicator centered around 0, it will also help make values originally below 1 have more importance in the scale.
POSSIBLE ERRORS
If you compare different types of markets the indicator might return NaN values, this is because one market might be closed, for example if you compare AMD against BTCUSD with the indicator you will get NaN values. If you really need to compare two markets then increase your time frame, else use an histogram or area plot in order to have a cleaner plot.
CONCLUSION
An original indicator comparing the volatility between two securities has been presented. The choice of posting a volatility indicator has been made by my twitter followers, so if you want to decide which type of indicator i should do next make sure to check my twitter to see if there are polls available (i should do one after every posted indicator).
Today proposed indicator aim to compare the estimated volatility of two instruments in order to provide various informations to the user, especially about risk and profitability.
CALCULATION
The relative normalized volatility (RNV) indicator is the ratio between the moving average of the absolute normalized price changes value of two securities, that is:
SMA(|Δ(a)/σ(a)|)
―――――――――――
SMA(|Δ(b)/σ(b)|)
Where a and b are two different securities (note that notation "Δ(x)" refer to the 1st difference of x, and the "||" notation is used to indicate absolute value, for example "|x|" means absolute value of x).
INTERPRETATION
The indicator aim tell us which security is more volatile between a and b, with a value of the indicator greater than 1 indicating that a is on average more volatile than b over the last length period, while a value lower than 1 indicating that the security b is more on average volatile than a.
The indicator use the current symbol as a, while the second security b must be defined in the setting window (by default the S&P500). Risk and profitability are closely related to volatility, as larger price variations could potentially mean larger losses (but also larger gains), therefore a value of the indicator greater than 1 can indicate that it could be more risked (and profitable) to trade security a.
RNV using AMD (top) volatility against Intel (bottom) volatility.
RNV using EURUSD (top) volatility against USDJPY (bottom) volatility.
Larger values of length will make the indicator fluctuate less often around 1. You can also plot the logarithm of the ratio instead in order to have the indicator centered around 0, it will also help make values originally below 1 have more importance in the scale.
POSSIBLE ERRORS
If you compare different types of markets the indicator might return NaN values, this is because one market might be closed, for example if you compare AMD against BTCUSD with the indicator you will get NaN values. If you really need to compare two markets then increase your time frame, else use an histogram or area plot in order to have a cleaner plot.
CONCLUSION
An original indicator comparing the volatility between two securities has been presented. The choice of posting a volatility indicator has been made by my twitter followers, so if you want to decide which type of indicator i should do next make sure to check my twitter to see if there are polls available (i should do one after every posted indicator).
Mã nguồn mở
Theo đúng tinh thần TradingView, tác giả của tập lệnh này đã công bố nó dưới dạng mã nguồn mở, để các nhà giao dịch có thể xem xét và xác minh chức năng. Chúc mừng tác giả! Mặc dù bạn có thể sử dụng miễn phí, hãy nhớ rằng việc công bố lại mã phải tuân theo Nội quy.
Check out the indicators we are making at luxalgo: tradingview.com/u/LuxAlgo/
"My heart is so loud that I can't hear the fireworks"
"My heart is so loud that I can't hear the fireworks"
Thông báo miễn trừ trách nhiệm
Thông tin và các ấn phẩm này không nhằm mục đích, và không cấu thành, lời khuyên hoặc khuyến nghị về tài chính, đầu tư, giao dịch hay các loại khác do TradingView cung cấp hoặc xác nhận. Đọc thêm tại Điều khoản Sử dụng.