OPEN-SOURCE SCRIPT
Strong Levels (with Proximity Alerts)
█ OVERVIEW
The "Strong Levels (with Proximity Alerts)" indicator offers a fresh approach to identifying support and resistance levels, inspired by the RexDog Trading System (RDTS). It pinpoints significant price reversals using a unique filtering method that reduces noise and enhances reliability. Paired with customizable ATR-based proximity alerts, this indicator empowers traders to track critical price zones with precision.
█ FEATURES
- Rooted in RDTS:
Inspired by the RexDog Trading System (RDTS), it highlights major pivot points where price executed sharp turnarounds, ensuring levels carry true market weight.
- Second-Highest/Lowest Open/Close Method:
Resistance levels use the *second-highest open/close* near pivot highs, while support levels use the *second-lowest open/close* near pivot lows—skipping extreme wicks for cleaner, more dependable lines.
- ATR-Driven Proximity Alerts:
Customizable proximity thresholds, calculated using the Average True Range (ATR), warn traders when price approaches key levels—a standout feature not found in most support/resistance indicators.
- Flexible Customization:
- Magnitude: Tweak pivot sensitivity (default: 10).
- Line Colors: Set resistance (red by default), support (green), and proximity (yellow) lines.
- Line Options: Adjust line origins, transparency for breached levels, and the maximum number of levels shown.
- ATR Settings: Fine-tune proximity sensitivity with ATR length and multiplier.
█ HOW TO USE
1. Add to Chart:
Find "Strong Levels (with Proximity Alerts)" in TradingView’s indicator library and apply it.
2. Read the Lines:
- Red Lines: Resistance, derived from the second-highest open/close near pivot highs.
- Green Lines: Support, based on the second-lowest open/close near pivot lows.
- Yellow Dashed Lines: Proximity thresholds (optional), signaling when price nears a level.
3. Customize:
- Raise `Magnitude` for stronger levels or lower it for more detail.
- Adjust colors, transparency, and max levels to fit your preferences.
- Toggle proximity thresholds on/off based on your trading style.
- Enabling *Plot Line from Actual Pivot Bar* offers a cleaner chart but may mislead as lines plot into the past.
4. Set Alerts:
- Open TradingView’s alert menu (the three dots ... dropdown menu next in indicator list has an option "Add alert on ...") and choose "Approaching Level" or "Level Touched.".
- Don't forget to choose the right Trigger condition, which by default is "Only Once". I usually set it to "Once Per Bar".
- Tailor alert conditions to your needs.
█ LIMITATIONS
- Past-Based Levels:
- Relying on historical pivots, it may not always forecast future moves, especially in rapid markets.
- The 'Plot Line from Actual Pivot Bar' option while visually appealing can imply historical significance that didn’t exist at the time. Be mindful of that.
- Volatility Sensitivity:
High volatility widens ATR-based thresholds, which might trigger alerts too soon.
- Display Management:
A cap on max levels avoids clutter, but tweaking `Max Levels` may be needed across timeframes.
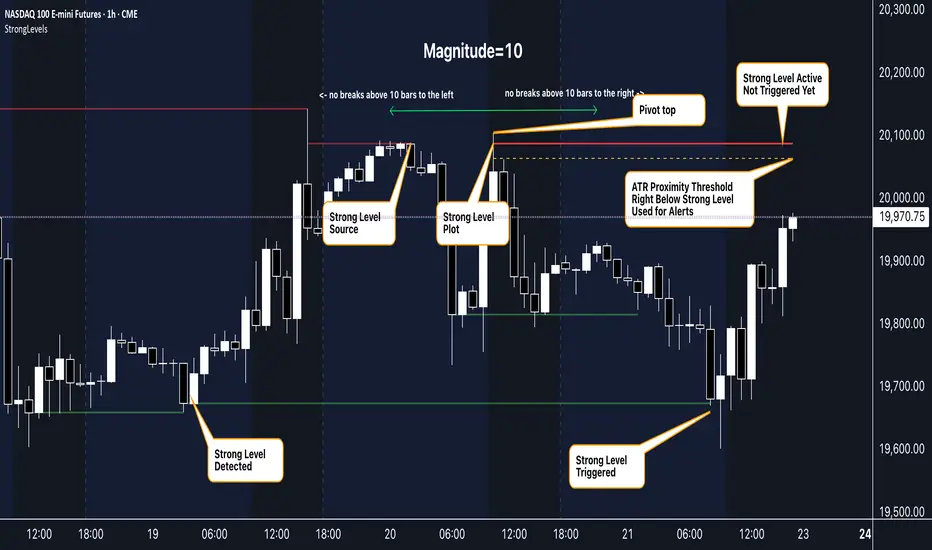
█ ACCOMPANYING CHART
The chart showcases the indicator’s unique edge:
- A pivot high and low are flagged, with nearby bars highlighted.
- Resistance is plotted at the *second-highest open/close* around the pivot high, bypassing the highest wick.
- Support is set at the *second-lowest open/close* near the pivot low, ignoring the deepest wick.
- Yellow dashed proximity lines illustrate how the indicator warns traders as price nears these zones.
- Annotations clarify how skipping extreme wicks creates cleaner, more actionable levels.
█ HOW TO USE
1. Add to Chart:
Locate "Strong Levels (with Proximity Alerts)" in TradingView’s indicator library and apply it to your chart.
2. Read the Lines:
- Red Lines**: Resistance levels, calculated from the second-highest open/close near pivot highs.
- Green Lines: Support levels, derived from the second-lowest open/close near pivot lows.
- Yellow Dashed Lines: Optional proximity thresholds, alerting you when price nears a level.
3. Customize:
- Increase `Magnitude` for stronger, less frequent levels or decrease it for more granularity.
- Modify colors, transparency, or the maximum number of levels to suit your style.
- Enable or disable proximity thresholds as needed.
4. Set Alerts:
- Access TradingView’s alert menu and select "Approaching Level" or "Level Touched."
- Adjust conditions to match your trading preferences.
5. My Personal Approach:
I prefer using this indicator on higher timeframes, like hourly or daily charts. I adjust my `Magnitude`, so it doesn't trigger too often and set my alerts to trigger "Once Per Bar". When price nears a level, I get an alert and I anticipate a reaction but avoid placing limit orders blindly. Instead, I switch to smaller timeframes and combine it with other tools for confirmation before making a trade. This saves me a lot of screen time, and allows me to focus when it matters.
The "Strong Levels (with Proximity Alerts)" indicator offers a fresh approach to identifying support and resistance levels, inspired by the RexDog Trading System (RDTS). It pinpoints significant price reversals using a unique filtering method that reduces noise and enhances reliability. Paired with customizable ATR-based proximity alerts, this indicator empowers traders to track critical price zones with precision.
█ FEATURES
- Rooted in RDTS:
Inspired by the RexDog Trading System (RDTS), it highlights major pivot points where price executed sharp turnarounds, ensuring levels carry true market weight.
- Second-Highest/Lowest Open/Close Method:
Resistance levels use the *second-highest open/close* near pivot highs, while support levels use the *second-lowest open/close* near pivot lows—skipping extreme wicks for cleaner, more dependable lines.
- ATR-Driven Proximity Alerts:
Customizable proximity thresholds, calculated using the Average True Range (ATR), warn traders when price approaches key levels—a standout feature not found in most support/resistance indicators.
- Flexible Customization:
- Magnitude: Tweak pivot sensitivity (default: 10).
- Line Colors: Set resistance (red by default), support (green), and proximity (yellow) lines.
- Line Options: Adjust line origins, transparency for breached levels, and the maximum number of levels shown.
- ATR Settings: Fine-tune proximity sensitivity with ATR length and multiplier.
█ HOW TO USE
1. Add to Chart:
Find "Strong Levels (with Proximity Alerts)" in TradingView’s indicator library and apply it.
2. Read the Lines:
- Red Lines: Resistance, derived from the second-highest open/close near pivot highs.
- Green Lines: Support, based on the second-lowest open/close near pivot lows.
- Yellow Dashed Lines: Proximity thresholds (optional), signaling when price nears a level.
3. Customize:
- Raise `Magnitude` for stronger levels or lower it for more detail.
- Adjust colors, transparency, and max levels to fit your preferences.
- Toggle proximity thresholds on/off based on your trading style.
- Enabling *Plot Line from Actual Pivot Bar* offers a cleaner chart but may mislead as lines plot into the past.
4. Set Alerts:
- Open TradingView’s alert menu (the three dots ... dropdown menu next in indicator list has an option "Add alert on ...") and choose "Approaching Level" or "Level Touched.".
- Don't forget to choose the right Trigger condition, which by default is "Only Once". I usually set it to "Once Per Bar".
- Tailor alert conditions to your needs.
█ LIMITATIONS
- Past-Based Levels:
- Relying on historical pivots, it may not always forecast future moves, especially in rapid markets.
- The 'Plot Line from Actual Pivot Bar' option while visually appealing can imply historical significance that didn’t exist at the time. Be mindful of that.
- Volatility Sensitivity:
High volatility widens ATR-based thresholds, which might trigger alerts too soon.
- Display Management:
A cap on max levels avoids clutter, but tweaking `Max Levels` may be needed across timeframes.
█ ACCOMPANYING CHART
The chart showcases the indicator’s unique edge:
- A pivot high and low are flagged, with nearby bars highlighted.
- Resistance is plotted at the *second-highest open/close* around the pivot high, bypassing the highest wick.
- Support is set at the *second-lowest open/close* near the pivot low, ignoring the deepest wick.
- Yellow dashed proximity lines illustrate how the indicator warns traders as price nears these zones.
- Annotations clarify how skipping extreme wicks creates cleaner, more actionable levels.
█ HOW TO USE
1. Add to Chart:
Locate "Strong Levels (with Proximity Alerts)" in TradingView’s indicator library and apply it to your chart.
2. Read the Lines:
- Red Lines**: Resistance levels, calculated from the second-highest open/close near pivot highs.
- Green Lines: Support levels, derived from the second-lowest open/close near pivot lows.
- Yellow Dashed Lines: Optional proximity thresholds, alerting you when price nears a level.
3. Customize:
- Increase `Magnitude` for stronger, less frequent levels or decrease it for more granularity.
- Modify colors, transparency, or the maximum number of levels to suit your style.
- Enable or disable proximity thresholds as needed.
4. Set Alerts:
- Access TradingView’s alert menu and select "Approaching Level" or "Level Touched."
- Adjust conditions to match your trading preferences.
5. My Personal Approach:
I prefer using this indicator on higher timeframes, like hourly or daily charts. I adjust my `Magnitude`, so it doesn't trigger too often and set my alerts to trigger "Once Per Bar". When price nears a level, I get an alert and I anticipate a reaction but avoid placing limit orders blindly. Instead, I switch to smaller timeframes and combine it with other tools for confirmation before making a trade. This saves me a lot of screen time, and allows me to focus when it matters.
Mã nguồn mở
Theo đúng tinh thần TradingView, tác giả của tập lệnh này đã công bố nó dưới dạng mã nguồn mở, để các nhà giao dịch có thể xem xét và xác minh chức năng. Chúc mừng tác giả! Mặc dù bạn có thể sử dụng miễn phí, hãy nhớ rằng việc công bố lại mã phải tuân theo Nội quy.
I'm a passionate software engineer and a trader. I love making trading tools. Follow me if you want to be kept up to date.
Thông báo miễn trừ trách nhiệm
Thông tin và các ấn phẩm này không nhằm mục đích, và không cấu thành, lời khuyên hoặc khuyến nghị về tài chính, đầu tư, giao dịch hay các loại khác do TradingView cung cấp hoặc xác nhận. Đọc thêm tại Điều khoản Sử dụng.