OPEN-SOURCE SCRIPT
Is the Bollinger Bands assumption wrong?
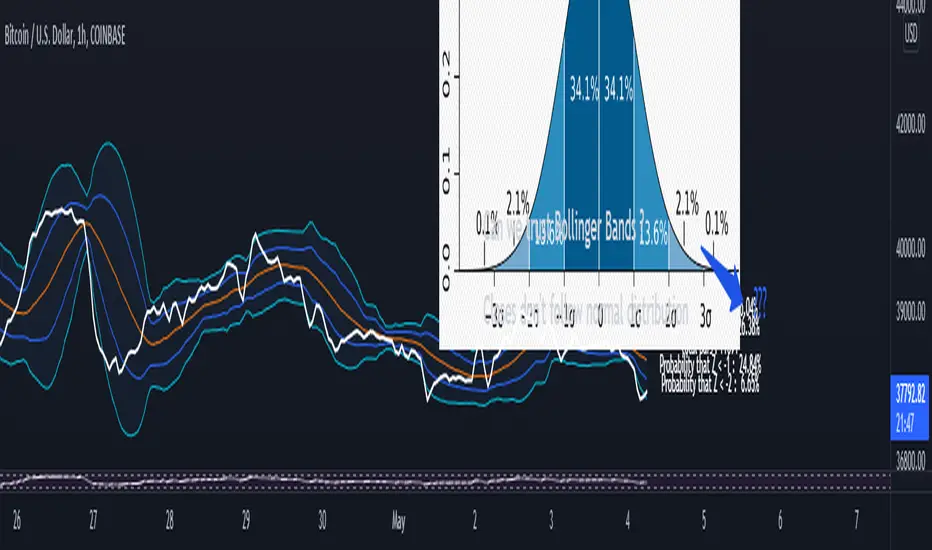
Bollinger Bands are the result of the assumption that closing prices will follow a normal distribution.
However, when I actually calculated the probability, the closing price does not follow a normal distribution.
According to the normal distribution, the probability that Z > 2 should be 2.2%, but on the chart, the probability is 6~9%.
Can we get a useful value for Bollinger Bands that we can use in our strategy?
We can measure volatility, but can we judge volatility based on a fixed value?
To the right of each Bollinger band value, the probability that the price is above the band is displayed.
The script is simply annotated with how each probability is calculated.
Mã nguồn mở
Theo tinh thần TradingView thực sự, tác giả của tập lệnh này đã xuất bản dưới dạng nguồn mở để các nhà giao dịch có thể hiểu và xác minh. Chúc mừng tác giả! Bạn có thể sử dụng miễn phí. Tuy nhiên, bạn cần sử dụng lại mã này theo Quy tắc nội bộ. Bạn có thể yêu thích nó để sử dụng nó trên biểu đồ.
Thông báo miễn trừ trách nhiệm
Thông tin và ấn phẩm không có nghĩa là và không cấu thành, tài chính, đầu tư, kinh doanh, hoặc các loại lời khuyên hoặc khuyến nghị khác được cung cấp hoặc xác nhận bởi TradingView. Đọc thêm trong Điều khoản sử dụng.