OPEN-SOURCE SCRIPT
Kaspa Power Law
Cập nhật
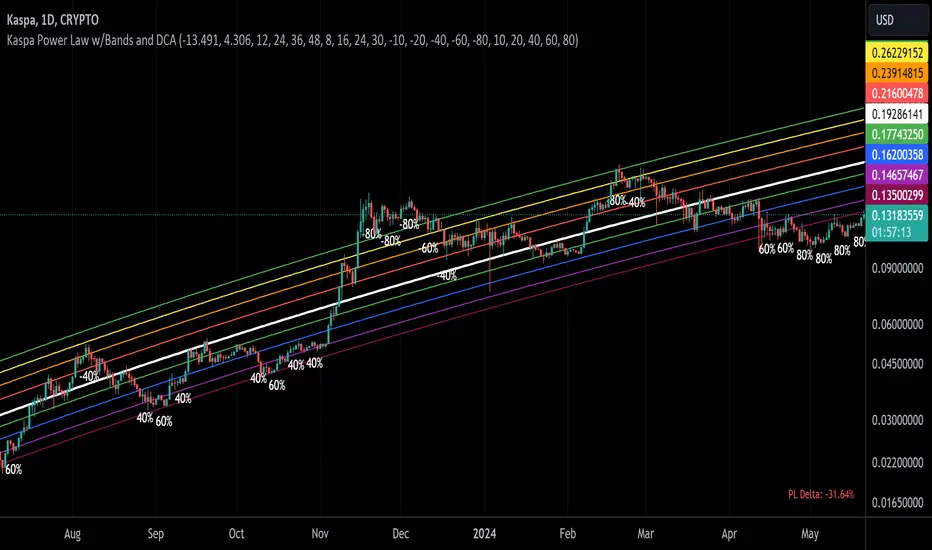
Simple Power Law Indicator for Kaspa with addition of adjustable bands above and below the Power Law Price. Best used on Logarithmic view on Daily Time Frame.
Phát hành các Ghi chú
Meant to be used on CRYPTO:KASUSD ticker on Daily time frame.This indicator is designed to help traders visualize the Power Law trend for Kaspa (KAS) with custom bands and Dollar-Cost Averaging (DCA) levels. It provides valuable insights into potential entry and exit points based on predefined price bands and DCA strategies.
Key Features:
Power Law Calculation: The primary trendline is calculated using a Power Law formula that represents long-term growth potential.
Customizable Bands: Users can specify percentage offsets to create bands above and below the Power Law trend. These bands provide a clearer picture of significant market ranges.
DCA Labels:
-Out Labels: When the price crosses above the Power Law trend into specified higher bands, it marks potential exit (sell) points.
-In Labels: When the price drops below the trendline into defined lower bands, it indicates potential buying opportunities.
Visibility Control: Each DCA level label (In or Out) can be independently toggled on or off to match your preferred trading strategy.
Usage Instructions:
Adjust Power Law Bands: Use the inputs to define the percentage offsets for each band above or below the trendline.
DCA Labels Control: Customize each DCA level label visibility using the checkbox options in the settings.
Phát hành các Ghi chú
Updated to include inputs to adjust Slope and Intercept as they change with time, as well as adjusted the power law calculation to make it more accurate. Also, added table to bottom right of screen that shows how much below or above KAS is from the estimated power law price.
Adjusted default settings for DCA at different bands, these are still fully adjustable to your liking.
Phát hành các Ghi chú
Summary of Features Added and Updated:-Updated Power Law Parameters: Adjusted intercept and slope values with user inputs.
-Google Sheet Link: Added a script comment with a link to a Google Sheet for updated slope and intercept values.
-User-defined Percentage Bands: Organized percentage bands into groups for both above and below the power law price.
-User-defined Allocation Amounts: Organized allocation amounts into groups for allocations above and below the power law price.
-Visibility Inputs for Labels: Added options to toggle visibility for different allocation levels, with default settings adjusted.
-Label Printing Interval: Added an input option to specify the interval type (daily or weekly) and interval value for printing labels.
-Dark Grey Text for Labels: Ensured label text color is dark grey to improve visibility on both light and dark backgrounds.
-Interval Logic: Implemented logic to correctly handle the label printing intervals based on user inputs for daily and weekly settings.
-Counter Reset Logic: Ensured counters reset appropriately after a label is printed based on the specified interval.
Live Google Sheet Link for Daily Updated Slope and Intercept:
docs.google.com/spreadsheets/d/1MZe-mDxHDXbMUh0JZ__aipkxO4mHOnj5QikzXL0BL1s/edit?usp=sharing
The PL Formula changes slightly as new data comes available with every daily close. The Google Sheet link above updates and re-calculated the PL formula daily. Updating your indicator every few months would be sufficient.
Mã nguồn mở
Theo tinh thần TradingView thực sự, tác giả của tập lệnh này đã xuất bản dưới dạng nguồn mở để các nhà giao dịch có thể hiểu và xác minh. Chúc mừng tác giả! Bạn có thể sử dụng miễn phí. Tuy nhiên, bạn cần sử dụng lại mã này theo Quy tắc nội bộ. Bạn có thể yêu thích nó để sử dụng nó trên biểu đồ.
Thông báo miễn trừ trách nhiệm
Thông tin và ấn phẩm không có nghĩa là và không cấu thành, tài chính, đầu tư, kinh doanh, hoặc các loại lời khuyên hoặc khuyến nghị khác được cung cấp hoặc xác nhận bởi TradingView. Đọc thêm trong Điều khoản sử dụng.