OPEN-SOURCE SCRIPT
Cập nhật Exponential Grid [Phi, Pi, Euler]
If you disagree with one of the EMH principles that price is too random, then by definition you must agree that historic price has deterministic function to a scenario ahead.
I personally believe that constants like phi, pi and e can mimic exponential growth of the price.
In this script, first grid is based on the Lowest price multiplied with self fraction of the constant.
For example:
If you are familiar with fib ratio 1.272, then you must know that it is 1.618 to the power of 0.5.
With default settings of exponent step 0.25
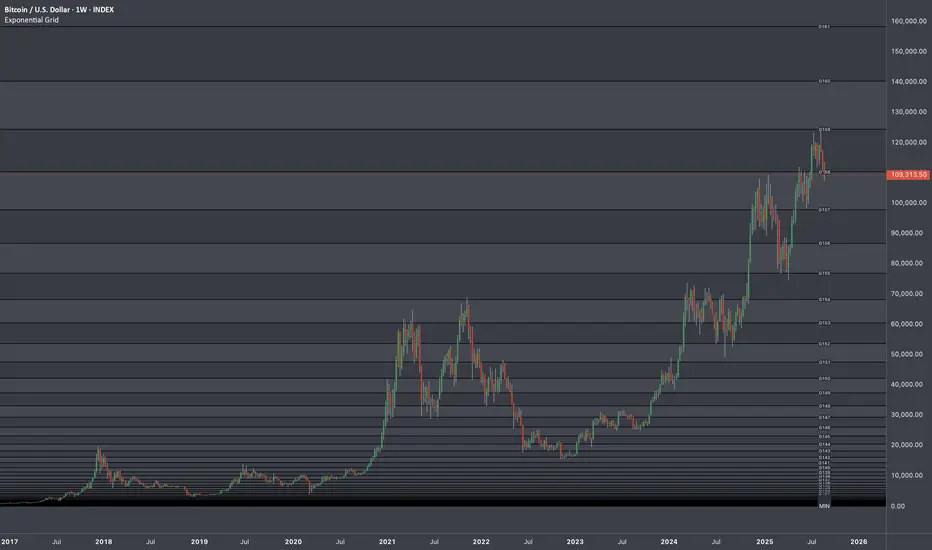
First grid = Lowest price x phi^0.25
Second grid = Lowest price x phi^0.25x2
Third grid = Lowest price x phi^0.25x3 and so on
The script will automatically find the lowest price and update the grid values.

Or you can set up your custom Lowest price manually if you feel like the All Time Low level loses its relevance value after long period.

There are 64 grids including Lowest price level. And it wasn't by a chance. Pine Script has a limitation of max 64 plots. Number of grids shown in the chart depends on the highest price. Once price breaks above ATH a couple of next grids will be plotted automatically. In most cases if everything is plotted, the chart appears squeezed and you'll need to zoom in to see it. Therefore, I adjusted it relatively to the scale of the chart for the comfort.
In some cases 64 plots aren't enough to cover the whole chart. For example, let's take a look at NVIDIA chart:

Since the price has started with 0.0333, it is way too small to cover all with default settings.
We are left with 2 choices:
Either Enable "Round"

OR increase Exponent Step (from 0.25 to 0.5 in the particular example below)

If you set constant to pi or e which is a bigger number than phi, expect the gaps to be bigger. To reduce it to a more gradual way of expansion you can decrease Exponent Step.
I personally believe that constants like phi, pi and e can mimic exponential growth of the price.
In this script, first grid is based on the Lowest price multiplied with self fraction of the constant.
For example:
If you are familiar with fib ratio 1.272, then you must know that it is 1.618 to the power of 0.5.
With default settings of exponent step 0.25
First grid = Lowest price x phi^0.25
Second grid = Lowest price x phi^0.25x2
Third grid = Lowest price x phi^0.25x3 and so on
The script will automatically find the lowest price and update the grid values.
Or you can set up your custom Lowest price manually if you feel like the All Time Low level loses its relevance value after long period.
There are 64 grids including Lowest price level. And it wasn't by a chance. Pine Script has a limitation of max 64 plots. Number of grids shown in the chart depends on the highest price. Once price breaks above ATH a couple of next grids will be plotted automatically. In most cases if everything is plotted, the chart appears squeezed and you'll need to zoom in to see it. Therefore, I adjusted it relatively to the scale of the chart for the comfort.
In some cases 64 plots aren't enough to cover the whole chart. For example, let's take a look at NVIDIA chart:
Since the price has started with 0.0333, it is way too small to cover all with default settings.
We are left with 2 choices:
Either Enable "Round"
OR increase Exponent Step (from 0.25 to 0.5 in the particular example below)
If you set constant to pi or e which is a bigger number than phi, expect the gaps to be bigger. To reduce it to a more gradual way of expansion you can decrease Exponent Step.
Phát hành các Ghi chú
As we know number of plots shown in the chart depends on highest price. Some people can't wait for it to break above to trigger new plots of higher levels. So I added ability to view more grids by adjusting multiplier that is tied to ATH that will satisfy the condition of showing more levels. (Don't worry it doesn't have any impact on calculation of the grids!)Increase to show relatively more.
I also restricted of using wrong inputs of Exponent Step. Reason:
Phát hành các Ghi chú
- Cleaned up the code and made it more consistent for coders' perspective. Made each new grid to be determined from previous grid values instead of referring to lowest for each level and doing extra multiplications. Same result but more efficient determination of the grid.
- Changed the rule of plots displayed to exactly what I initially intended to introduce. Increased the range of min and max values of "Plots Regulator" to be able to adjust number of plots shown in more flexible way. Added a hint in user inputs for proper exploitation.
I found its use after noticing a chart like this:
If we were on daily timeframe we would still see those high levels locked to the indicator making a chart look too squeezed.
We could just manually adjust the scale by zooming every time as a solution. But if we want to keep the scale automatic and simply reduce the number of outputs without changing "Exponent Step" (which would mess up chosen proportions), then we can simply decrease arguments for "Plots Regulator" to work with more relevant levels to the desired scale.
Phát hành các Ghi chú
- From now on code uses line function instead of plots, which doubled the number of grid lines available. (Plot function had a limits of 64)
- Runs faster than previous version. Code is simplified to reduce the pressure on hardware.
Phát hành các Ghi chú
- Fixed a minor issue with output of labels
- Added ability to change the color of lines
Phát hành các Ghi chú
A minor but necessary update:- Restored All time low (which was earlier distorted)
- "Exponent" is now called "Rate of Progression" and is collapsed to a separate location below "Constant" to simplify user experience.
Phát hành các Ghi chú
Stability improvementsPhát hành các Ghi chú
- Increased number of lines near 500
- Added 0.33 and 0.75 for the Progression Rate.
Mã nguồn mở
Theo đúng tinh thần TradingView, tác giả của tập lệnh này đã công bố nó dưới dạng mã nguồn mở, để các nhà giao dịch có thể xem xét và xác minh chức năng. Chúc mừng tác giả! Mặc dù bạn có thể sử dụng miễn phí, hãy nhớ rằng việc công bố lại mã phải tuân theo Nội quy.
Unlock exclusive tools: fractlab.com
ᴀʟʟ ᴄᴏɴᴛᴇɴᴛ ᴘʀᴏᴠɪᴅᴇᴅ ʙʏ ꜰʀᴀᴄᴛʟᴀʙ ɪꜱ ɪɴᴛᴇɴᴅᴇᴅ ꜰᴏʀ ɪɴꜰᴏʀᴍᴀᴛɪᴏɴᴀʟ ᴀɴᴅ ᴇᴅᴜᴄᴀᴛɪᴏɴᴀʟ ᴘᴜʀᴘᴏꜱᴇꜱ ᴏɴʟʏ.
ᴘᴀꜱᴛ ᴘᴇʀꜰᴏʀᴍᴀɴᴄᴇ ɪꜱ ɴᴏᴛ ɪɴᴅɪᴄᴀᴛɪᴠᴇ ᴏꜰ ꜰᴜᴛᴜʀᴇ ʀᴇꜱᴜʟᴛꜱ.
ᴀʟʟ ᴄᴏɴᴛᴇɴᴛ ᴘʀᴏᴠɪᴅᴇᴅ ʙʏ ꜰʀᴀᴄᴛʟᴀʙ ɪꜱ ɪɴᴛᴇɴᴅᴇᴅ ꜰᴏʀ ɪɴꜰᴏʀᴍᴀᴛɪᴏɴᴀʟ ᴀɴᴅ ᴇᴅᴜᴄᴀᴛɪᴏɴᴀʟ ᴘᴜʀᴘᴏꜱᴇꜱ ᴏɴʟʏ.
ᴘᴀꜱᴛ ᴘᴇʀꜰᴏʀᴍᴀɴᴄᴇ ɪꜱ ɴᴏᴛ ɪɴᴅɪᴄᴀᴛɪᴠᴇ ᴏꜰ ꜰᴜᴛᴜʀᴇ ʀᴇꜱᴜʟᴛꜱ.
Thông báo miễn trừ trách nhiệm
Thông tin và các ấn phẩm này không nhằm mục đích, và không cấu thành, lời khuyên hoặc khuyến nghị về tài chính, đầu tư, giao dịch hay các loại khác do TradingView cung cấp hoặc xác nhận. Đọc thêm tại Điều khoản Sử dụng.