OPEN-SOURCE SCRIPT
VOLD-MarketBreadth-Ratio
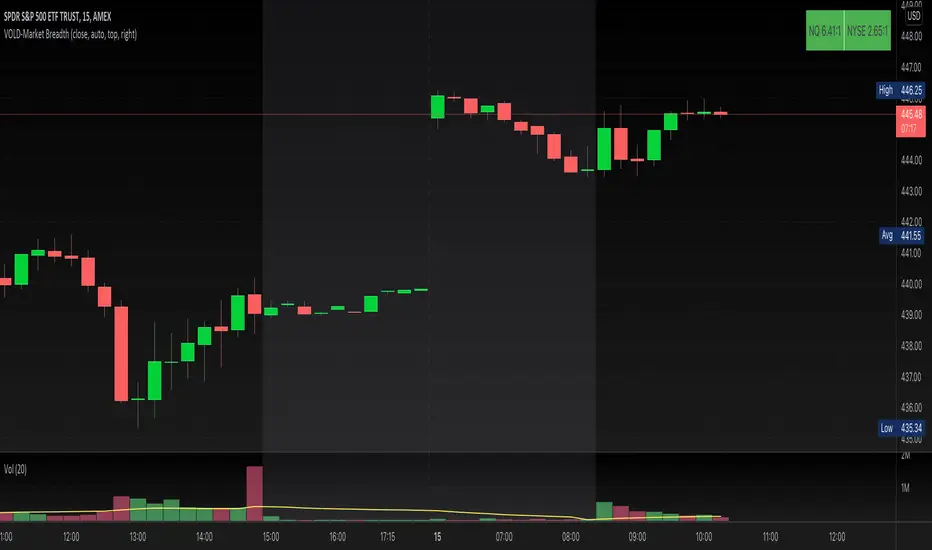
This script provides NASDAQ and NYSE Up Volume (volume in rising stocks) and Down Volume (volume in falling stocks) ratio. Up Volume is higher than Down Volume, then you would see green label with ratio e.g 3.5:1. This means Up Volume is 3.5 times higher than Down Volume - Positive Market Breadth. If Down Volume is higher than Up Volume, then you would see red label with ratio e.g -4.5:1. This means Down Volume is 4.5 times higher than Up Volume.
For example, ratio is 1:1, then it is considered Market Breadth is Neutral.
PS: Currently TradingView provides only NASDAQ Composite Market volume data. I have requested them to provide Primary NASDAQ volume data. If they respond with new ticket for primary NQ data, I will update the script and publish the updated version. So if you have got similar table on ToS, you would see minor difference in NQ ratio.
Mã nguồn mở
Theo đúng tinh thần TradingView, tác giả của tập lệnh này đã công bố nó dưới dạng mã nguồn mở, để các nhà giao dịch có thể xem xét và xác minh chức năng. Chúc mừng tác giả! Mặc dù bạn có thể sử dụng miễn phí, hãy nhớ rằng việc công bố lại mã phải tuân theo Nội quy.
Thông báo miễn trừ trách nhiệm
Thông tin và các ấn phẩm này không nhằm mục đích, và không cấu thành, lời khuyên hoặc khuyến nghị về tài chính, đầu tư, giao dịch hay các loại khác do TradingView cung cấp hoặc xác nhận. Đọc thêm tại Điều khoản Sử dụng.