OPEN-SOURCE SCRIPT
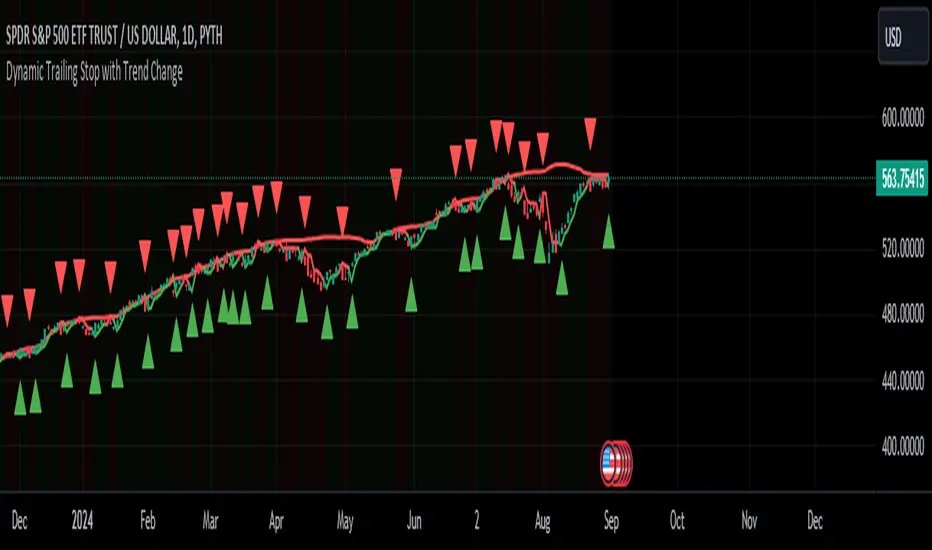
Dynamic Trailing Stop with Trend Change
Key features of this script:
Trend Identification: Uses previous day's high/low breaks to identify trend changes.
Uptrend starts when price closes above the previous day's high.
Downtrend starts when price closes below the previous day's low.
Dynamic Trailing Stop:
In an uptrend, the stop is set to the previous day's low and trails higher.
In a downtrend, the stop is set to the previous day's high and trails lower.
Visual Indicators:
Green triangle for uptrend start, red triangle for downtrend start.
Green/red line for the trailing stop.
Background color changes to light green in uptrends, light red in downtrends.
Alerts:
Trend change alerts when a new trend is identified.
Stop hit alerts when price crosses the trailing stop, suggesting a potential exit.
This implementation allows you to:
Identify trend changes based on previous day's high/low breaks.
Trail your stop loss dynamically as the trend progresses.
Get visual and alert-based signals for trend changes and potential exit points.
For swing trading, you could:
Enter long when an uptrend starts (green triangle).
Set your initial stop loss to the trailing stop (green line).
Exit if the price closes below the trailing stop or a downtrend starts (red triangle).
(Reverse for short trades)
Remember, while this strategy can be effective, it's important to combine it with other forms of analysis and proper risk management. The effectiveness can vary depending on the volatility of the asset and overall market conditions. Always test thoroughly before using in live trading.
Mã nguồn mở
Theo đúng tinh thần TradingView, tác giả của tập lệnh này đã công bố nó dưới dạng mã nguồn mở, để các nhà giao dịch có thể xem xét và xác minh chức năng. Chúc mừng tác giả! Mặc dù bạn có thể sử dụng miễn phí, hãy nhớ rằng việc công bố lại mã phải tuân theo Nội quy.
Thông báo miễn trừ trách nhiệm
Thông tin và các ấn phẩm này không nhằm mục đích, và không cấu thành, lời khuyên hoặc khuyến nghị về tài chính, đầu tư, giao dịch hay các loại khác do TradingView cung cấp hoặc xác nhận. Đọc thêm tại Điều khoản Sử dụng.