OPEN-SOURCE SCRIPT
Day-of-Week Performance
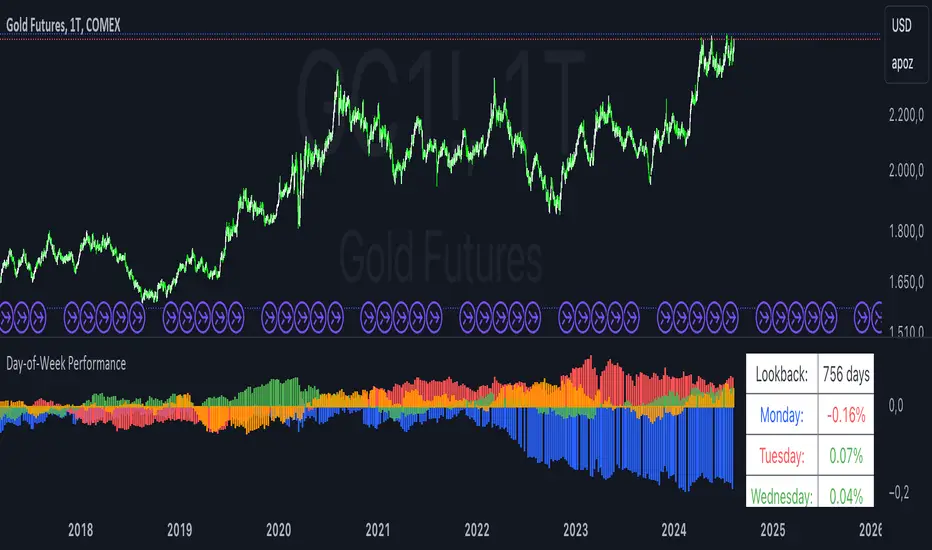
This Pine Script indicator calculates and displays the average performance for each weekday over a specified lookback period on a chart. The performance is computed based on the percentage change from the open to the close price of each day.
Features:
Lookback Period:
Input field to specify the number of days to look back for calculating performance. The default is set to 756 days.
Performance Calculation:
Calculates the average percentage change from open to close for each weekday (Monday through Friday) within the specified lookback period.
Histogram Plots:
Displays histograms on the chart for each weekday. Each histogram represents the average performance of that day of the week.
Histograms are plotted with distinct colors:
Monday: Blue
Tuesday: Red
Wednesday: Green
Thursday: Orange
Friday: Purple
Performance Table:
A table is displayed in the top-right corner of the chart showing the average percentage performance for each weekday.
The table updates with the lookback period and the calculated average performance values for each weekday.
Positive performance values are shown in green, and negative values are shown in red.
This indicator helps visualize day-of-the-week performance trends, providing insights into which days typically perform better or worse over the specified period.
Mã nguồn mở
Theo đúng tinh thần TradingView, tác giả của tập lệnh này đã công bố nó dưới dạng mã nguồn mở, để các nhà giao dịch có thể xem xét và xác minh chức năng. Chúc mừng tác giả! Mặc dù bạn có thể sử dụng miễn phí, hãy nhớ rằng việc công bố lại mã phải tuân theo Nội quy.
Where others speculate, we systematize.
edgetools.org
edgetools.org
Thông báo miễn trừ trách nhiệm
Thông tin và các ấn phẩm này không nhằm mục đích, và không cấu thành, lời khuyên hoặc khuyến nghị về tài chính, đầu tư, giao dịch hay các loại khác do TradingView cung cấp hoặc xác nhận. Đọc thêm tại Điều khoản Sử dụng.