OPEN-SOURCE SCRIPT
Cập nhật Binance Leveraged Liquidations Approximation
Binance Leveraged Liquidations Approximation (BLLA)
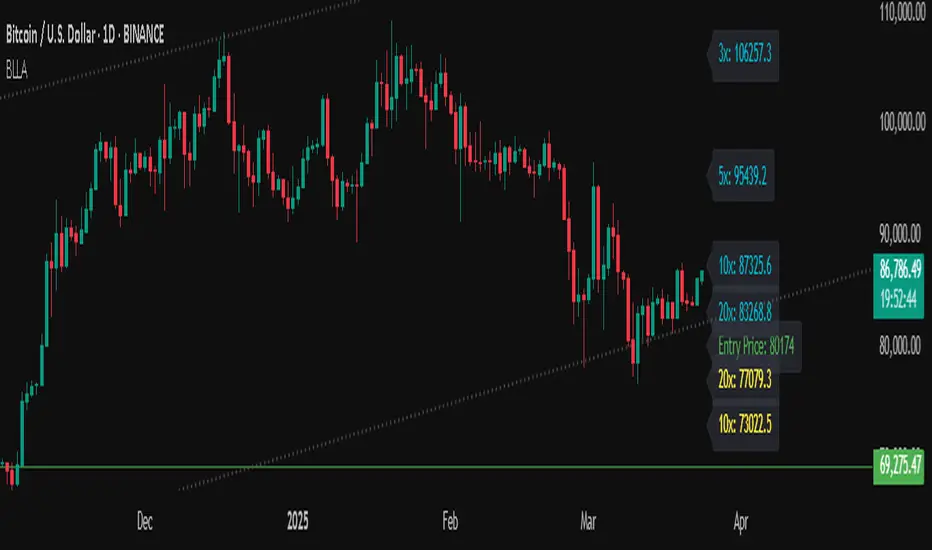
The Binance Leveraged Liquidations Approximation (BLLA) indicator is a tool designed to estimate liquidation levels for leveraged trading on Binance. It calculates the approximate prices at which liquidations could occur for long and short positions, based on the entry price and leverage levels selected by the user.
Key Features:
Customization:
Clear Visualization:
Recommended Use:
Settings:
Quick Instructions:
Note:
This indicator is an approximation and does not guarantee absolute accuracy of liquidation levels, as these may vary depending on market conditions and exchange policies.
The Binance Leveraged Liquidations Approximation (BLLA) indicator is a tool designed to estimate liquidation levels for leveraged trading on Binance. It calculates the approximate prices at which liquidations could occur for long and short positions, based on the entry price and leverage levels selected by the user.
Key Features:
- Liquidation Level Calculation:
- Estimates liquidation prices for multiple leverage levels (e.g., 20x, 10x, 5x, etc.).
- Supports both long and short positions.
Customization:
- Allows the user to manually input the entry price or automatically calculate it as the midpoint between the low and high of a defined period.
- Leverage levels are configurable, enabling the indicator to adapt to different trading strategies.
Clear Visualization:
- Displays liquidation levels directly on the chart, with labels indicating the corresponding leverage.
- Uses distinct colors for long positions (yellow) and short positions (blue).
Recommended Use:
- Risk Management: Helps identify liquidation levels to adjust stop-loss orders and manage risk in leveraged trading.
- Market Analysis: Provides a quick overview of key levels where significant price movements might occur due to mass liquidations.
Settings:
- Entry Price: Enter manually or leave at 0.0 to calculate automatically.
- Leverage: Configure desired leverage levels (e.g., 20x, 10x, 5x, etc.).
- Transparency and Display: Adjust the transparency of the lines and the number of bars displayed.
Quick Instructions:
- Add the indicator to your chart.
- Enter the entry price or leave it at 0.0 to calculate automatically.
- Configure leverage levels according to your strategy.
- Observe liquidation levels on the chart and use them to manage your risk.
Note:
This indicator is an approximation and does not guarantee absolute accuracy of liquidation levels, as these may vary depending on market conditions and exchange policies.
Phát hành các Ghi chú
Binance Leveraged Liquidations Approximation (BLLA)Overview
The Binance Leveraged Liquidations Approximation (BLLA) indicator is designed to estimate liquidation levels for leveraged trading on Binance. It calculates the approximate prices at which liquidations may occur for long and short positions based on the user's selected entry price and leverage levels.
This indicator has been optimized specifically for Binance and has been tested in real trading scenarios, ensuring its accuracy in practical use. Its uniqueness lies in allowing users to customize a wide range of leverage inputs while also offering an automated entry calculation, making it an excellent guide for new traders.
Key Features
• Liquidation Level Calculation
• Estimates liquidation prices for multiple leverage levels (e.g., 20x, 10x, 5x, etc.).
• Supports both long and short positions.
Customization
• Allows users to manually input the entry price or automatically calculate it as the midpoint between the low and high of a defined period.
• Leverage levels are configurable, adapting the indicator to different trading strategies.
Clear Visualization
• Displays liquidation levels directly on the chart, with labels indicating the corresponding leverage.
• Uses distinct colors for long positions (yellow) and short positions (blue).
Recommended Use
• Risk Management: Helps identify liquidation levels to adjust stop-loss orders and manage risk in leveraged trading.
• Market Analysis: Provides a quick overview of key levels where significant price movements might occur due to mass liquidations.
Settings
• Entry Price: Enter manually or leave at 0.0 to calculate automatically.
• Leverage: Configure desired leverage levels (e.g., 20x, 10x, 5x, etc.).
• Transparency: Adjust the labels transparency.
How to Use the BLLA Indicator in Futures Trading
As a futures trader, risk management is essential for long-term profitability. The BLLA indicator is a valuable tool for visualizing approximate liquidation levels and anticipating potential market movements. Below is how I integrate it into my trading strategy.
1. Identifying Risk Zones Before Entering a Trade
Before opening a position, I analyze the liquidation levels at different leverage levels. This helps me answer questions such as:
• Where would my liquidation price be if I use 10x or 20x leverage?
• Am I trading near a potential mass liquidation zone that could trigger high volatility?
• How should I adjust my stop-loss to avoid premature liquidation?
Practical Example: If I want to enter a long position but see that the 10x and 20x liquidation levels are very close to the current price, I reconsider my risk exposure or wait for a better entry point.
2. Using It for Entry and Exit Strategies
I use the BLLA indicator to identify entry confirmations and potential exit points based on market structure and liquidity.
• Entry: If the price approaches a mass liquidation level, I wait for a reaction before entering. If I observe order absorption or rejection at that level, it could be a good time to open a position.
• Exit: If I am already in a trade and the price nears a liquidation level, I may take partial profits or adjust my stop-loss to secure gains.
Practical Example:
Suppose I enter a short position, and I see that the next long liquidation level is 3% lower. In this case, I may hold the trade until the price reaches that level, as it could trigger a bounce.
3. Anticipating Impulsive Moves
The futures market reacts strongly to liquidation events. When multiple positions are liquidated at the same level, a cascade effect can occur, causing sharp price movements.
I use the BLLA indicator to identify potential zones where this could happen:
• Breakouts: If the price approaches a significant liquidation zone, I prepare for a strong move in that direction.
• Fake Breakouts: If the price sweeps a liquidation level and reverses, it might be a liquidity trap.
Practical Example: If I notice liquidity building near a mass liquidation level, I prepare to trade the breakout while keeping a tight stop-loss to minimize risk.
Why the BLLA Indicator is Unique
• Optimized for Binance: The calculation model has been refined specifically for Binance’s liquidation mechanism.
• Tested in Real Trading Scenarios: The indicator has been validated in actual leveraged trading operations.
• Extensive Customization: Users can configure multiple leverage levels, making it adaptable to various trading strategies.
• Guided Automatic Entry Calculation: The automatic entry feature helps new users understand key levels without needing to manually set values.
Final Tips for Maximizing Its Use
• Do not rely on this indicator alone. Combine it with volume, order flow, and market structure analysis.
• Avoid excessive leverage. Understanding liquidation levels helps in choosing safer leverage.
• Capitalize on others’ liquidations. Identifying these zones gives an advantage in finding better trade entries.
• Adjust settings to match your strategy. Configure leverage levels based on your trading style.
{Important Note}
This indicator provides an approximation and does not guarantee the absolute accuracy of liquidation levels, as they may vary based on market conditions and exchange policies.
Mã nguồn mở
Theo đúng tinh thần TradingView, tác giả của tập lệnh này đã công bố nó dưới dạng mã nguồn mở, để các nhà giao dịch có thể xem xét và xác minh chức năng. Chúc mừng tác giả! Mặc dù bạn có thể sử dụng miễn phí, hãy nhớ rằng việc công bố lại mã phải tuân theo Nội quy.
Thông báo miễn trừ trách nhiệm
Thông tin và các ấn phẩm này không nhằm mục đích, và không cấu thành, lời khuyên hoặc khuyến nghị về tài chính, đầu tư, giao dịch hay các loại khác do TradingView cung cấp hoặc xác nhận. Đọc thêm tại Điều khoản Sử dụng.