OPEN-SOURCE SCRIPT
EWMA Volatility Bands
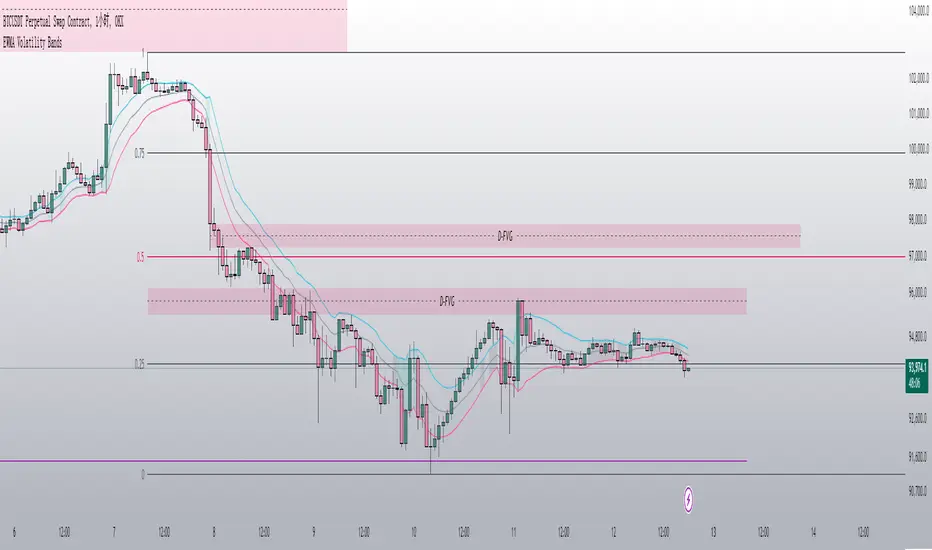
The EWMA Volatility Bands indicator combines an Exponential Moving Average (EMA) and Exponentially Weighted Moving Average (EWMA) of volatility to create dynamic upper and lower price bands. It helps traders identify trends, measure market volatility, and spot extreme conditions. Key features include:
Centerline (EMA): Tracks the trend based on a user-defined period.
Volatility Bands: Adjusted by the square root of volatility, representing potential price ranges.
Percentile Rank: Highlights extreme volatility (e.g., >99% or <1%) with shaded areas between the bands.
This tool is useful for trend-following, risk assessment, and identifying overbought/oversold conditions.
Mã nguồn mở
Theo đúng tinh thần TradingView, tác giả của tập lệnh này đã công bố nó dưới dạng mã nguồn mở, để các nhà giao dịch có thể xem xét và xác minh chức năng. Chúc mừng tác giả! Mặc dù bạn có thể sử dụng miễn phí, hãy nhớ rằng việc công bố lại mã phải tuân theo Nội quy.
Thông báo miễn trừ trách nhiệm
Thông tin và các ấn phẩm này không nhằm mục đích, và không cấu thành, lời khuyên hoặc khuyến nghị về tài chính, đầu tư, giao dịch hay các loại khác do TradingView cung cấp hoặc xác nhận. Đọc thêm tại Điều khoản Sử dụng.