OPEN-SOURCE SCRIPT
Ultimate RSIs
Cập nhật
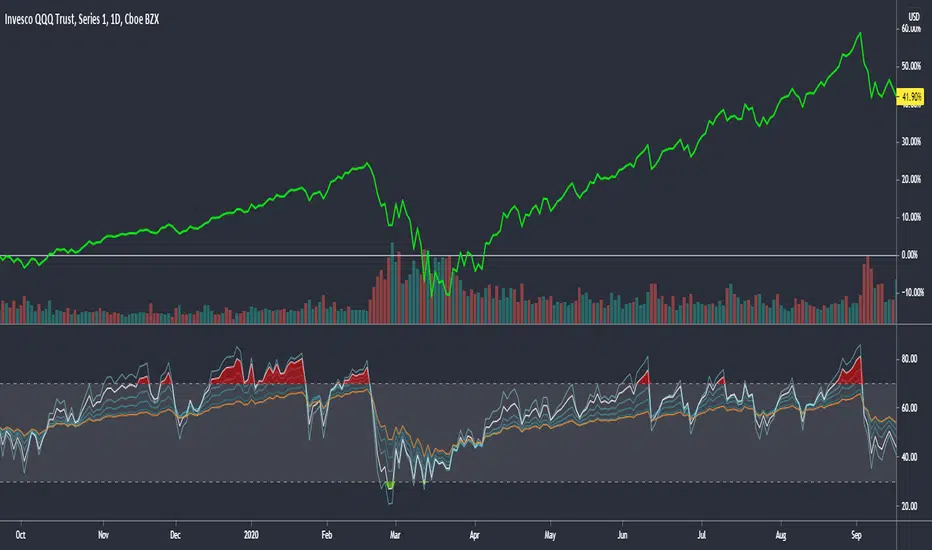
This RSI script includes everything you could want on an RSI. There are multiple timeframes which will give context to market movement, as well as a highlight feature to make it easier to visualize overbought and oversold stocks.
Tip: Uncheck the 4 plots with no color in them to remove the extra headers on the indicator.
Tip: Uncheck the 4 plots with no color in them to remove the extra headers on the indicator.
Phát hành các Ghi chú
The values of the default RSIs have been updated to give a more useful contextual view of the market. For example: the orange RSI band is calibrated to reach Overbought within the dotcom bubble on QQQ. If you see a stock with an orange RSI in overbought territory, it should indicate a fall, or a long period of flat returns to cool off.Phát hành các Ghi chú
Update is being made to correct the image in order to comply with ToS.Mã nguồn mở
Theo tinh thần TradingView thực sự, tác giả của tập lệnh này đã xuất bản dưới dạng nguồn mở để các nhà giao dịch có thể hiểu và xác minh. Chúc mừng tác giả! Bạn có thể sử dụng miễn phí. Tuy nhiên, bạn cần sử dụng lại mã này theo Quy tắc nội bộ. Bạn có thể yêu thích nó để sử dụng nó trên biểu đồ.
Thông báo miễn trừ trách nhiệm
Thông tin và ấn phẩm không có nghĩa là và không cấu thành, tài chính, đầu tư, kinh doanh, hoặc các loại lời khuyên hoặc khuyến nghị khác được cung cấp hoặc xác nhận bởi TradingView. Đọc thêm trong Điều khoản sử dụng.