OPEN-SOURCE SCRIPT
Tesla Coil
Cập nhật
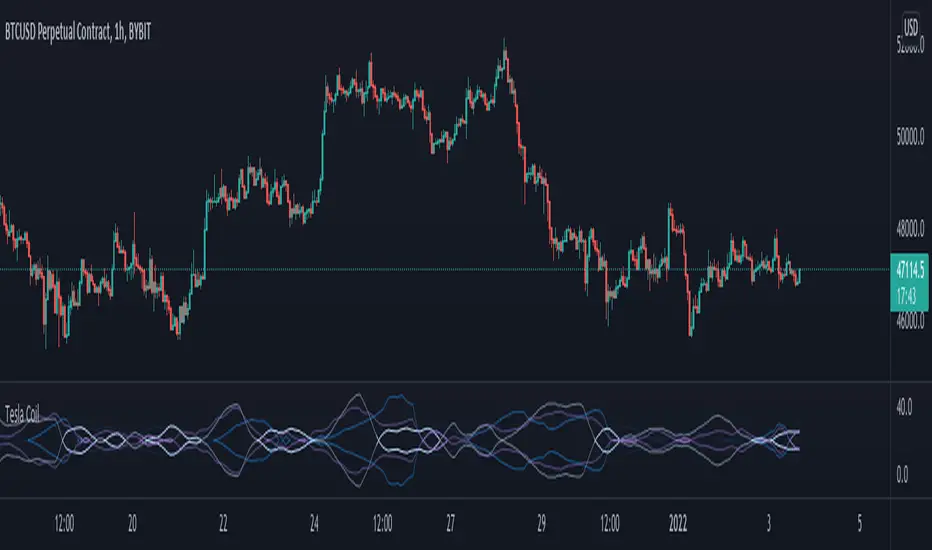
This indicator reads the charts as frequency because the charts are just waves after all. This is an excellent tool for finding "Booms" and detecting dumps. Booms are found when all the frequencies pull under the red 20 line. Dumps are detected when all the lines drag themselves along the 20 line as seen is screenshots below.

Below is another 2 examples of a "boom". Everything sucks in before exploding out.

Below is an example of a dump:

Below is another 2 examples of a "boom". Everything sucks in before exploding out.
Below is an example of a dump:
Phát hành các Ghi chú
Added signals for pos and neg crossover. Added bg coloring. Added alerts for pos/neg crossover and "boom" for when all lines are under 20. Added mirror option.Phát hành các Ghi chú
A big shout out to KryptoBeau for the latest update and improvements. Here are the changes:144 plot(len1 * 3 ,"3xlen1", color=#bbd9fb)//original line
155 cond1 = rcm < 20 and len < 20 and average < 20 and len1 < 20//original line - had problems because of the len1*3 issue
160 cond3 = crossunder(average,20)//KB edit from "crossover"
166 bgcolor(cond2 and bgcolor ? color.new(color.white, transp=inputBackgroundTransparency) : na, title="cond2 Background")//KB changed from cond1.
169 plotshape(signals ? cond3 : na, title="Neg Crossover", location=location.top, style=shape.circle, size=size.tiny, color=color.new(color.red, transp=20))//KB Edit to Neg Cross over not Pos Crossover
Phát hành các Ghi chú
Tesla coil is now easier to read. Use this indicator to pin point the best trades and exact moment of explosion. Enter trade on a crossover and you skip the sideways wait before a breakout. Look for crosses on each set of lines. Lines light up as it pulls in for an explosion. Big things also happen when the purple and light blue lines cross. Use with a fast oscillator like boom hunter pro and it is hard to make a bad trade. EnjoyPhát hành các Ghi chú
Minor fix to alerts. Alerts trigger when the white lines cross, when the purple lines cross and when the blue lines cross.There are 3 lines displayed. All are based on formulas by John Ehlers. These lines measure the cycles of charts, using them together we can enter trades at the beginning/end of cycles. These are moments of extreme volatility.
Cosine IFM - An instantaneous frequency measurement of dominant cycle periods.
In-phase and quadrature IFM - An instantaneous frequency measurement of dominant cycle periods using in-phase and quadrature analysis.
Average - Average of the 2 above lines as well as RCM. These are strong cycle measurements as it uses 3 sets of data to find the mean.
The white and purple lines will help find explosive volatility.
Mã nguồn mở
Theo tinh thần TradingView thực sự, tác giả của tập lệnh này đã xuất bản dưới dạng nguồn mở để các nhà giao dịch có thể hiểu và xác minh. Chúc mừng tác giả! Bạn có thể sử dụng miễn phí. Tuy nhiên, bạn cần sử dụng lại mã này theo Quy tắc nội bộ. Bạn có thể yêu thích nó để sử dụng nó trên biểu đồ.
Thông báo miễn trừ trách nhiệm
Thông tin và ấn phẩm không có nghĩa là và không cấu thành, tài chính, đầu tư, kinh doanh, hoặc các loại lời khuyên hoặc khuyến nghị khác được cung cấp hoặc xác nhận bởi TradingView. Đọc thêm trong Điều khoản sử dụng.