OPEN-SOURCE SCRIPT
Bullish Breakout After Consolidation
Description:
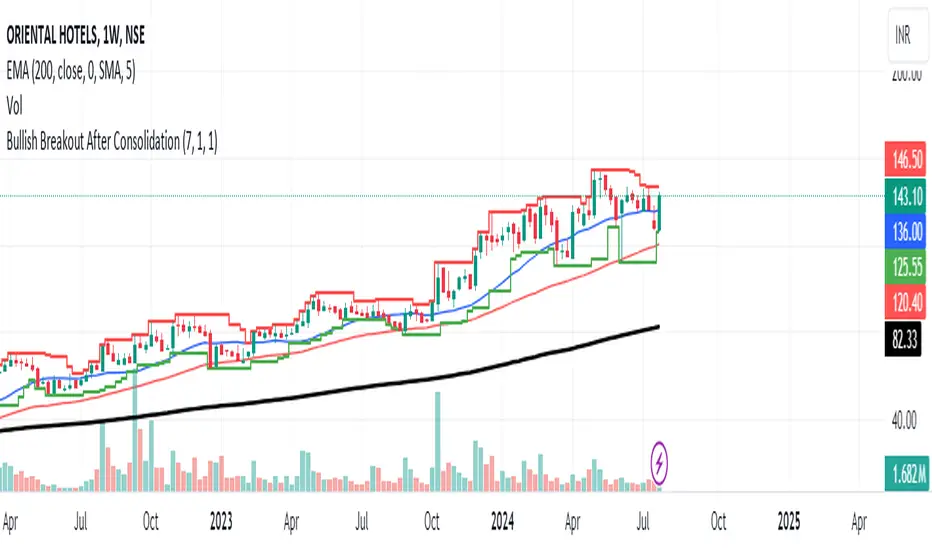
The Bullish Breakout After Consolidation Indicator is designed to help traders identify potential bullish breakout opportunities following a period of tight price consolidation. This indicator combines price action and volume analysis to signal when a stock may experience a significant upward movement.
Features:
Consolidation Range Tightness: The indicator identifies periods where the stock price consolidates within a narrow range, defined as a range less than 2% of the lowest low during the consolidation period. This tight consolidation is often a precursor to strong price movements.
Breakout Detection: Once the price breaks above the highest high of the consolidation range, and this breakout occurs after a specified number of days post-consolidation, the indicator marks it as a potential breakout opportunity.
Volume Confirmation: To avoid false breakouts, the indicator requires increased trading volume during the breakout. This ensures that the breakout is supported by substantial market activity.
Visual Cues:
Breakout Label: A "Breakout" label appears above the bar where a valid breakout occurs, making it easy to spot potential entry points.
Support and Resistance Lines: Horizontal lines plot the highest high (resistance) and lowest low (support) during the consolidation period, helping traders visualize the breakout levels.
Moving Averages: Optional 20-day and 50-day simple moving averages are plotted for additional trend confirmation.
How to Use:
Apply the Indicator: Add the indicator to your chart in TradingView to start analyzing potential breakouts.
Observe Consolidation: Look for tight consolidation periods where the price trades within a narrow range.
Identify Breakouts: Watch for breakouts where the price moves above the highest high of the consolidation range, supported by increased volume.
Confirm with Labels: The "Breakout" label will help you quickly identify valid breakout signals.
Parameters:
Consolidation Length: Number of days to consider for consolidation.
Range Percentage: Maximum percentage range for consolidation tightness.
Days After Consolidation: Number of days post-consolidation to check for the breakout.
Note: As with any trading tool, it is important to use this indicator as part of a broader trading strategy and in conjunction with other forms of analysis.
Disclaimer: This indicator is provided for educational purposes and should not be construed as financial advice. Trading involves risk and may not be suitable for all investors.
Mã nguồn mở
Theo đúng tinh thần TradingView, tác giả của tập lệnh này đã công bố nó dưới dạng mã nguồn mở, để các nhà giao dịch có thể xem xét và xác minh chức năng. Chúc mừng tác giả! Mặc dù bạn có thể sử dụng miễn phí, hãy nhớ rằng việc công bố lại mã phải tuân theo Nội quy.
Thông báo miễn trừ trách nhiệm
Thông tin và các ấn phẩm này không nhằm mục đích, và không cấu thành, lời khuyên hoặc khuyến nghị về tài chính, đầu tư, giao dịch hay các loại khác do TradingView cung cấp hoặc xác nhận. Đọc thêm tại Điều khoản Sử dụng.