OPEN-SOURCE SCRIPT
FVG Breakaway/3rd Candle (Arjo) [MK]
Simple script to identify FVGs (Fair Value Gaps) on the current chart timeframe. The script differs from other FVG indicators on the Tradingview platform by using Arjos 3rd candle rule to identify which gaps are 'Breakway Gaps' and which Gaps are likely to be returned to.
NOTE: As with all 'trading rules' this theory is not 100% accurate.
default settings:
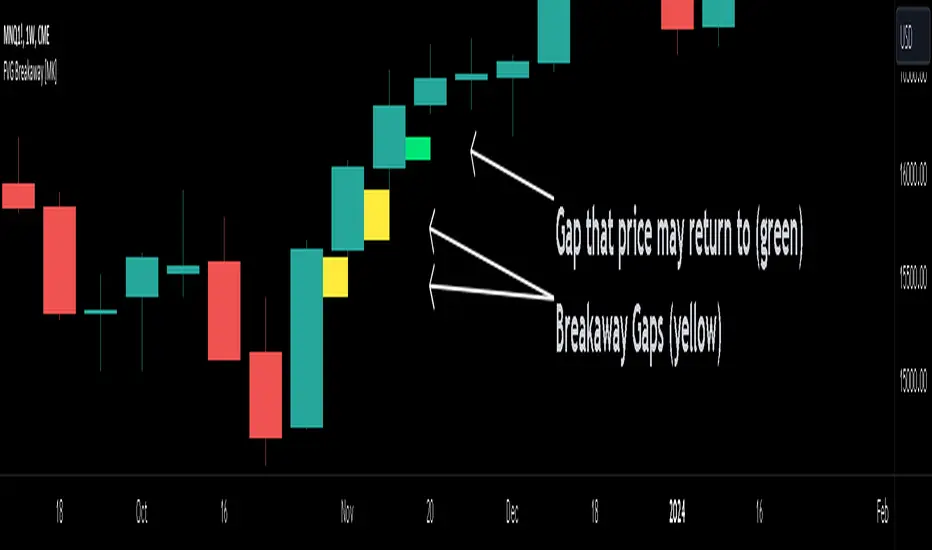
Breakaway Gaps = YELLOW
Gaps that price may return to = GREEN
Mitigated Gaps = 100% TRANSPARENT
What is a FVG:
A FVG is a price area defined by a 3 candle pattern. For a bullish FVG, the low of the 3rd candle must be higher than the high of the 1st candle. This then leaves an area that is drawn as in the example below:

A bearish FVG is defined by the high of the 3rd candle being lower than the low of the 1st candle, as shown in the example below:

FVGs can act like magnets where price will either retrace to or reach for, therefore they can be used as entry points and also for take profit target levels.
If for example, a trader would like to use an FVG for an entry, it would be useful to know which FVGs are more likely for price to re-enter and which FVG will be left un-touched. FVGs that are likely to be left un-touched by price are called 'Breakaway Gaps'.
How do we define a 'Breakaway Gap':
First we identify FVGs using the rules stated above, then we look to see where the 3rd candle closed in relation to the 2nd candle. For a bullish 'Breakaway Gap' we want to see the 3rd candle close above the high of the 2nd candle. An example of a bullish Breakaway Gap is shown in the example below:

A bearish 'Breakaway Gap' is defined by the close of the 3rd candle being lower than the low of the 2nd candle. An example is shown below:

How do we define an FVG that price may return to:
Any gap that does not meet the above rules for a 'Breakway Gap' is therefore considered an FVG that price may return to. So for a bullish FVG that price may return to we would look to see if the close of the 3rd candle is above the high of the 2nd candle. If it is not above the high of the 2nd candle then it more likely that price will retrace into the FVG before continuing higher. An example is shown below:

A bearish gap that price may return to is defined by the close of the 3rd candle not being lower than the low of the 2nd candle. An example is shown below:

The indicator is based on the teachings of 'Arjo'. Note: breakaway gaps will only remain 'breakaway' until a liquidity level is reached. Breakaways therefore do not remain 'breakaway' forever. Users of the indicators must fully comprehend this theory before using the indicator with live markets.
Users of the script should be fully aware of this concept and also have conducted thorough backtesting using a large data set before using this indicator with live accounts.
NOTE: As with all 'trading rules' this theory is not 100% accurate.
default settings:
Breakaway Gaps = YELLOW
Gaps that price may return to = GREEN
Mitigated Gaps = 100% TRANSPARENT
What is a FVG:
A FVG is a price area defined by a 3 candle pattern. For a bullish FVG, the low of the 3rd candle must be higher than the high of the 1st candle. This then leaves an area that is drawn as in the example below:
A bearish FVG is defined by the high of the 3rd candle being lower than the low of the 1st candle, as shown in the example below:
FVGs can act like magnets where price will either retrace to or reach for, therefore they can be used as entry points and also for take profit target levels.
If for example, a trader would like to use an FVG for an entry, it would be useful to know which FVGs are more likely for price to re-enter and which FVG will be left un-touched. FVGs that are likely to be left un-touched by price are called 'Breakaway Gaps'.
How do we define a 'Breakaway Gap':
First we identify FVGs using the rules stated above, then we look to see where the 3rd candle closed in relation to the 2nd candle. For a bullish 'Breakaway Gap' we want to see the 3rd candle close above the high of the 2nd candle. An example of a bullish Breakaway Gap is shown in the example below:
A bearish 'Breakaway Gap' is defined by the close of the 3rd candle being lower than the low of the 2nd candle. An example is shown below:
How do we define an FVG that price may return to:
Any gap that does not meet the above rules for a 'Breakway Gap' is therefore considered an FVG that price may return to. So for a bullish FVG that price may return to we would look to see if the close of the 3rd candle is above the high of the 2nd candle. If it is not above the high of the 2nd candle then it more likely that price will retrace into the FVG before continuing higher. An example is shown below:
A bearish gap that price may return to is defined by the close of the 3rd candle not being lower than the low of the 2nd candle. An example is shown below:
The indicator is based on the teachings of 'Arjo'. Note: breakaway gaps will only remain 'breakaway' until a liquidity level is reached. Breakaways therefore do not remain 'breakaway' forever. Users of the indicators must fully comprehend this theory before using the indicator with live markets.
Users of the script should be fully aware of this concept and also have conducted thorough backtesting using a large data set before using this indicator with live accounts.
Mã nguồn mở
Theo tinh thần TradingView thực sự, tác giả của tập lệnh này đã xuất bản dưới dạng nguồn mở để các nhà giao dịch có thể hiểu và xác minh. Chúc mừng tác giả! Bạn có thể sử dụng miễn phí. Tuy nhiên, bạn cần sử dụng lại mã này theo Quy tắc nội bộ. Bạn có thể yêu thích nó để sử dụng nó trên biểu đồ.
Thông báo miễn trừ trách nhiệm
Thông tin và ấn phẩm không có nghĩa là và không cấu thành, tài chính, đầu tư, kinh doanh, hoặc các loại lời khuyên hoặc khuyến nghị khác được cung cấp hoặc xác nhận bởi TradingView. Đọc thêm trong Điều khoản sử dụng.