OPEN-SOURCE SCRIPT
Cập nhật Open Lines (Daily/W/M/Q/Yearly)
Overview
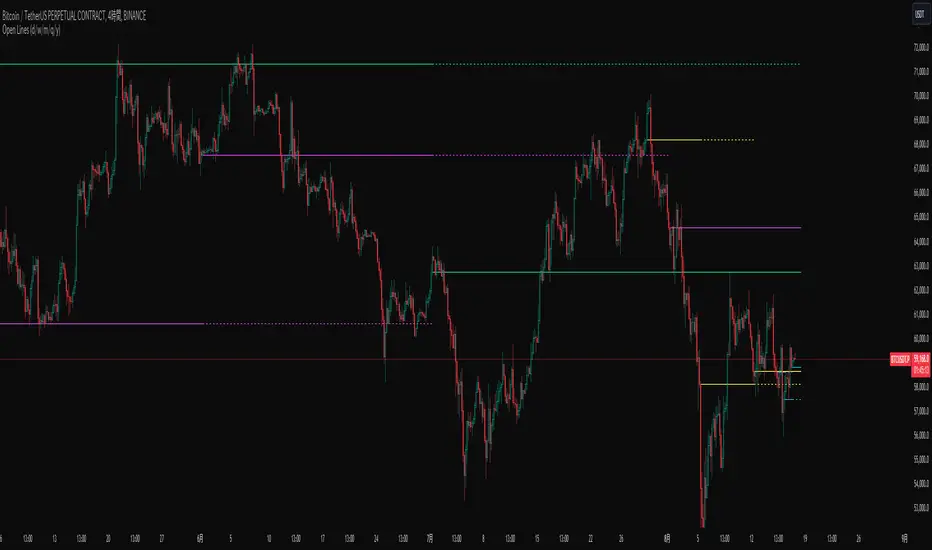
This script draws horizontal lines based on the opening prices of daily, weekly, monthly, quarterly, and yearly candles. A unique feature of this script is the ability to overlay lines from previous periods onto the current period. For example, it can draw the opening price line of the current month as well as the line from the previous month. This allows you to observe not only the battle between bullish and bearish candles of the current period but also the battle over whether the current candle engulfs the previous candle.
Settings
1. Common Settings for Daily to Yearly
Typically, an Extend value of 1 is sufficient, but you can increase this value if you want to observe engulfing patterns spanning multiple periods.
2. Style Settings
To differentiate between the current and past lines, the following settings are available:
Available styles are as follows:
3. Other Settings
This script draws horizontal lines based on the opening prices of daily, weekly, monthly, quarterly, and yearly candles. A unique feature of this script is the ability to overlay lines from previous periods onto the current period. For example, it can draw the opening price line of the current month as well as the line from the previous month. This allows you to observe not only the battle between bullish and bearish candles of the current period but also the battle over whether the current candle engulfs the previous candle.
Settings
1. Common Settings for Daily to Yearly
- On: Toggles the line drawing ON/OFF.
- Line: Sets how many periods back the line should be drawn from the current period.
- Extend: Sets how many periods into the future the lines from past candles should be extended.
Typically, an Extend value of 1 is sufficient, but you can increase this value if you want to observe engulfing patterns spanning multiple periods.
2. Style Settings
To differentiate between the current and past lines, the following settings are available:
- Current session line style: Sets the style for the line representing the opening price of the current candle.
- Next session line style: Sets the style for the line representing the opening price of past candles.
Available styles are as follows:
- sol: solid line
- dsh: dashed line
- dot: dotted line
3. Other Settings
- Allow overlapping of different session lines: By default, this setting prevents overlapping lines when candles from different periods open at the same time. Enabling this option allows lines from different periods, such as quarterly and monthly, to be drawn simultaneously if they overlap. By default, only the lines from the higher time frame are drawn.
Phát hành các Ghi chú
Two new features have been added to enhance functionality:1. Session-based Line Drawing:
- You can now draw lines based on the opening price of any specified intraday session.
2. Labels:
- Labels are now drawn at each opening price.
- These labels are aligned to the right side of the screen.
Phát hành các Ghi chú
Adjusting input propertiesMã nguồn mở
Theo đúng tinh thần TradingView, tác giả của tập lệnh này đã công bố nó dưới dạng mã nguồn mở, để các nhà giao dịch có thể xem xét và xác minh chức năng. Chúc mừng tác giả! Mặc dù bạn có thể sử dụng miễn phí, hãy nhớ rằng việc công bố lại mã phải tuân theo Nội quy.
Thông báo miễn trừ trách nhiệm
Thông tin và các ấn phẩm này không nhằm mục đích, và không cấu thành, lời khuyên hoặc khuyến nghị về tài chính, đầu tư, giao dịch hay các loại khác do TradingView cung cấp hoặc xác nhận. Đọc thêm tại Điều khoản Sử dụng.
Mã nguồn mở
Theo đúng tinh thần TradingView, tác giả của tập lệnh này đã công bố nó dưới dạng mã nguồn mở, để các nhà giao dịch có thể xem xét và xác minh chức năng. Chúc mừng tác giả! Mặc dù bạn có thể sử dụng miễn phí, hãy nhớ rằng việc công bố lại mã phải tuân theo Nội quy.
Thông báo miễn trừ trách nhiệm
Thông tin và các ấn phẩm này không nhằm mục đích, và không cấu thành, lời khuyên hoặc khuyến nghị về tài chính, đầu tư, giao dịch hay các loại khác do TradingView cung cấp hoặc xác nhận. Đọc thêm tại Điều khoản Sử dụng.