OPEN-SOURCE SCRIPT
Weekly Trading Strategy
Strategy Overview:
This trading strategy is designed for short-term trades over weekly intervals, utilizing the combination of Simple Moving Averages (SMA) for trend identification and the Relative Strength Index (RSI) for overbought/oversold conditions. It aims to capitalize on momentum shifts while mitigating the risk of entering a market at extreme points.
Key Components:
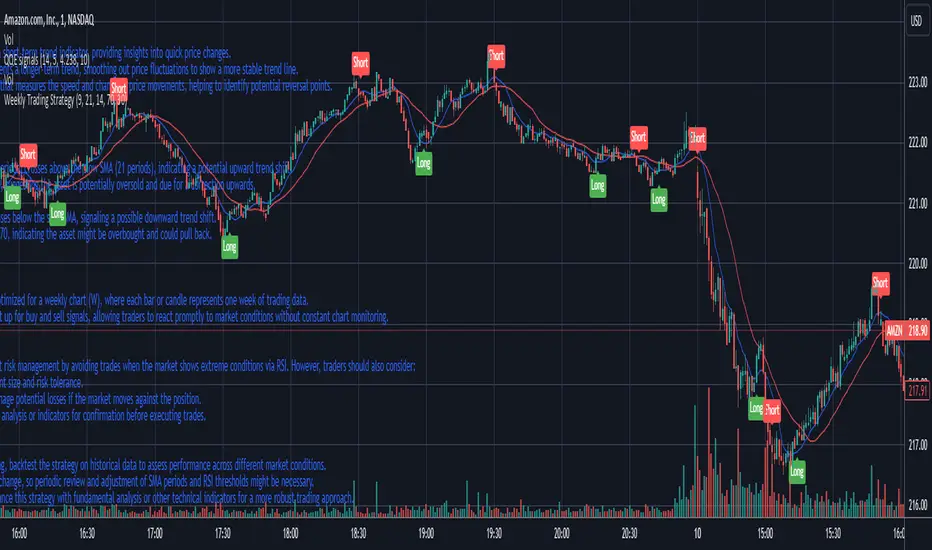
Fast SMA (9 periods): Acts as a short-term trend indicator, providing insights into quick price changes.
Slow SMA (21 periods): Represents a longer-term trend, smoothing out price fluctuations to show a more stable trend line.
RSI (14 periods): An oscillator that measures the speed and change of price movements, helping to identify potential reversal points.
Entry Signals:
Buy Signal:
Condition 1: The fast SMA (9 periods) crosses above the slow SMA (21 periods), indicating a potential upward trend shift.
Condition 2: RSI falls below 30, suggesting the asset is potentially oversold and due for a correction upwards.
Sell Signal:
Condition 1: The fast SMA crosses below the slow SMA, signaling a possible downward trend shift.
Condition 2: RSI climbs above 70, indicating the asset might be overbought and could pull back.
Strategy Execution:
Timeframe: This strategy is optimized for a weekly chart (W), where each bar or candle represents one week of trading data.
Alert System: Alerts can be set up for buy and sell signals, allowing traders to react promptly to market conditions without constant chart monitoring.
Risk Management:
This strategy includes inherent risk management by avoiding trades when the market shows extreme conditions via RSI. However, traders should also consider:
Position sizing based on account size and risk tolerance.
Setting stop-loss orders to manage potential losses if the market moves against the position.
Considering additional market analysis or indicators for confirmation before executing trades.
Considerations:
Backtesting: Before live trading, backtest the strategy on historical data to assess performance across different market conditions.
Adaptation: Market dynamics change, so periodic review and adjustment of SMA periods and RSI thresholds might be necessary.
Complementary Analysis: Enhance this strategy with fundamental analysis or other technical indicators for a more robust trading approach.
This strategy is suited for traders looking for weekly swings in the market, balancing between following the trend and spotting potential reversals. However, like all trading strategies, it should not be used in isolation but as part of a broader trading plan.
This trading strategy is designed for short-term trades over weekly intervals, utilizing the combination of Simple Moving Averages (SMA) for trend identification and the Relative Strength Index (RSI) for overbought/oversold conditions. It aims to capitalize on momentum shifts while mitigating the risk of entering a market at extreme points.
Key Components:
Fast SMA (9 periods): Acts as a short-term trend indicator, providing insights into quick price changes.
Slow SMA (21 periods): Represents a longer-term trend, smoothing out price fluctuations to show a more stable trend line.
RSI (14 periods): An oscillator that measures the speed and change of price movements, helping to identify potential reversal points.
Entry Signals:
Buy Signal:
Condition 1: The fast SMA (9 periods) crosses above the slow SMA (21 periods), indicating a potential upward trend shift.
Condition 2: RSI falls below 30, suggesting the asset is potentially oversold and due for a correction upwards.
Sell Signal:
Condition 1: The fast SMA crosses below the slow SMA, signaling a possible downward trend shift.
Condition 2: RSI climbs above 70, indicating the asset might be overbought and could pull back.
Strategy Execution:
Timeframe: This strategy is optimized for a weekly chart (W), where each bar or candle represents one week of trading data.
Alert System: Alerts can be set up for buy and sell signals, allowing traders to react promptly to market conditions without constant chart monitoring.
Risk Management:
This strategy includes inherent risk management by avoiding trades when the market shows extreme conditions via RSI. However, traders should also consider:
Position sizing based on account size and risk tolerance.
Setting stop-loss orders to manage potential losses if the market moves against the position.
Considering additional market analysis or indicators for confirmation before executing trades.
Considerations:
Backtesting: Before live trading, backtest the strategy on historical data to assess performance across different market conditions.
Adaptation: Market dynamics change, so periodic review and adjustment of SMA periods and RSI thresholds might be necessary.
Complementary Analysis: Enhance this strategy with fundamental analysis or other technical indicators for a more robust trading approach.
This strategy is suited for traders looking for weekly swings in the market, balancing between following the trend and spotting potential reversals. However, like all trading strategies, it should not be used in isolation but as part of a broader trading plan.
Mã nguồn mở
Theo đúng tinh thần TradingView, tác giả của tập lệnh này đã công bố nó dưới dạng mã nguồn mở, để các nhà giao dịch có thể xem xét và xác minh chức năng. Chúc mừng tác giả! Mặc dù bạn có thể sử dụng miễn phí, hãy nhớ rằng việc công bố lại mã phải tuân theo Nội quy.
Thông báo miễn trừ trách nhiệm
Thông tin và các ấn phẩm này không nhằm mục đích, và không cấu thành, lời khuyên hoặc khuyến nghị về tài chính, đầu tư, giao dịch hay các loại khác do TradingView cung cấp hoặc xác nhận. Đọc thêm tại Điều khoản Sử dụng.