PROTECTED SOURCE SCRIPT
ATR - FS
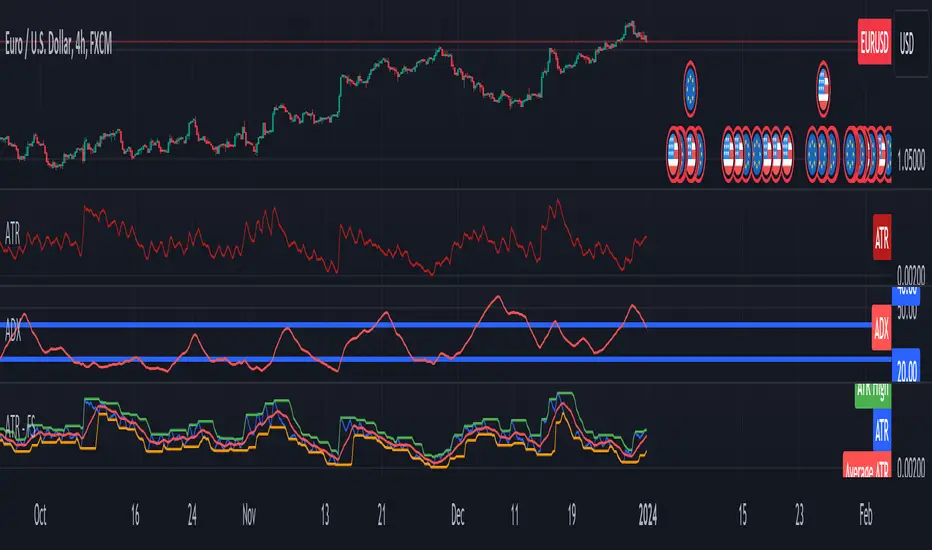
This script calculates and visualizes the Average True Range (ATR) along with its moving average, highest, and lowest values over a defined period. The ATR is a widely used volatility indicator in trading that measures the degree of price movement within a market. By incorporating both the average ATR and the high/low ranges, this script provides a comprehensive view of market volatility dynamics.
Use Cases:
Volatility-Based Trading:
Traders can use this indicator to gauge market volatility and adjust their trading strategies accordingly. For example:
During high volatility periods (high ATR values), traders might widen their stop-loss levels to accommodate larger price swings.
Conversely, during low volatility periods, traders may tighten their stop-loss levels to capture profits before the market moves against them.
Trend Identification:
The moving average of ATR helps traders identify long-term volatility trends, which can indicate the strength of a market trend:
Volatility Breakouts:
By analyzing the highest and lowest ATR values, traders can spot potential breakout opportunities:
Risk Management:
The ATR is a critical tool in risk management, helping traders set stop-losses and position sizes based on market conditions:
Use Cases:
Volatility-Based Trading:
Traders can use this indicator to gauge market volatility and adjust their trading strategies accordingly. For example:
- High ATR values often indicate periods of high volatility, suggesting larger price swings and more aggressive trading opportunities.
- Low ATR values signal quieter market conditions, where range-bound trading or less aggressive positioning might be favorable.
- Stop-Loss & Take-Profit Placement:
- The ATR is commonly used to determine optimal stop-loss and take-profit levels:
During high volatility periods (high ATR values), traders might widen their stop-loss levels to accommodate larger price swings.
Conversely, during low volatility periods, traders may tighten their stop-loss levels to capture profits before the market moves against them.
Trend Identification:
The moving average of ATR helps traders identify long-term volatility trends, which can indicate the strength of a market trend:
- If the average ATR is increasing, it could suggest the continuation of a strong trend.
- A decreasing average ATR may indicate the start of a consolidation period or weakening trend.
Volatility Breakouts:
By analyzing the highest and lowest ATR values, traders can spot potential breakout opportunities:
- A sudden spike in ATR (breaking above the green line) can indicate a breakout from a consolidation phase.
- Dropping below the orange line may signal a period of market stagnation or consolidation.
Risk Management:
The ATR is a critical tool in risk management, helping traders set stop-losses and position sizes based on market conditions:
- Higher ATR values might prompt a trader to reduce their position size to account for larger potential losses.
- Lower ATR values may encourage a trader to take on larger positions, as the market risk is lower.
Mã được bảo vệ
Tập lệnh này được đăng dưới dạng mã nguồn đóng. Tuy nhiên, bạn có thể sử dụng tự do và không giới hạn – tìm hiểu thêm tại đây.
Thông báo miễn trừ trách nhiệm
Thông tin và các ấn phẩm này không nhằm mục đích, và không cấu thành, lời khuyên hoặc khuyến nghị về tài chính, đầu tư, giao dịch hay các loại khác do TradingView cung cấp hoặc xác nhận. Đọc thêm tại Điều khoản Sử dụng.