OPEN-SOURCE SCRIPT
Cập nhật ADX, RSI, & TSI utilized as ART [by KeremErtem]
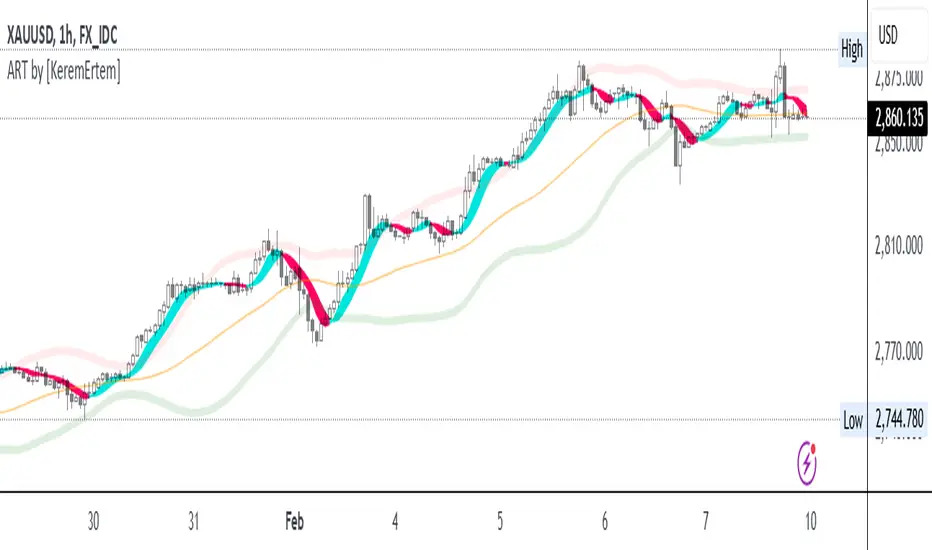
The "ADX, RSI, & TSI utilized as ART" script is an advanced technical analysis tool designed by Kerem Ertem to help traders identify trend direction, strength, and potential reversals. It integrates the Average Directional Index (ADX), Relative Strength Index (RSI), and True Strength Index (TSI) into a cohesive, user-friendly indicator known as ART (Adaptive Relative Trend).
What it does:
Trend Detection: Utilizes ADX to identify the strength and direction of trends.
Momentum Analysis: Uses RSI to gauge the speed and change of price movements.
Signal Smoothing: Incorporates TSI to reduce noise and provide clearer signals.
How it works:
Input Settings: Customize the source (hlc3), signal period (l1), and lookback range (l2) to tailor the indicator to your trading strategy.
Angle Calculation (ACI): The script calculates the angle of price movements using a custom function, which combines the lowest and highest prices with moving averages to create a smoother representation of trend angles.
Weighted Average: The ACI function is applied to the source price to derive a weighted average, which serves as the foundation for further calculations.
RSI Integration: The script calculates the RSI based on the weighted average price and further refines it using the ACI function to enhance signal accuracy.
ADX Calculation: ADX values are computed and adjusted using the ACI function to provide a clearer indication of trend strength and direction.
ART Indicator: The combined results of the RSI and ADX calculations form the ART indicator, which is plotted alongside trend lines and bands for comprehensive trend analysis.
Bands and Trend Lines: The script plots upper, lower, and center bands based on standard deviation and moving averages, providing visual cues for potential support and resistance levels.
How to use it:
Customization: Adjust the signal period, lookback range, RSI length, and ADX settings to fit your trading preferences.
Interpretation: Green ART signal lines indicate bullish trends, while red lines indicate bearish trends. The trend line color changes from cyan to magenta based on the trend direction.
Bands: Use the upper and lower bands as potential entry and exit points, with the center line acting as a trend confirmation.
This script offers a comprehensive approach to trend and momentum analysis, making it a valuable tool for traders seeking to enhance their trading strategies with advanced technical indicators.
Phát hành các Ghi chú
The "ADX, RSI, & TSI utilized as ART" script is an advanced technical analysis tool designed by Kerem Ertem to help traders identify trend direction, strength, and potential reversals. It integrates the Average Directional Index (ADX), Relative Strength Index (RSI), and True Strength Index (TSI) into a cohesive, user-friendly indicator known as ART (Adaptive Relative Trend).What it does:
• Trend Detection: Utilizes ADX to identify the strength and direction of trends.
• Momentum Analysis: Uses RSI to gauge the speed and change of price movements.
• Signal Smoothing: Incorporates TSI to reduce noise and provide clearer signals.
How it works:
1. Input Settings: Customize the source (hlc3), signal period (l1), and lookback range (l2) to tailor the indicator to your trading strategy.
2. Angle Calculation (ACI): The script calculates the angle of price movements using a custom function, which combines the lowest and highest prices with moving averages to create a smoother representation of trend angles.
3. Weighted Average: The ACI function is applied to the source price to derive a weighted average, which serves as the foundation for further calculations.
4. RSI Integration: The script calculates the RSI based on the weighted average price and further refines it using the ACI function to enhance signal accuracy.
5. ADX Calculation: ADX values are computed and adjusted using the ACI function to provide a clearer indication of trend strength and direction.
6. ART Indicator: The combined results of the RSI and ADX calculations form the ART indicator, which is plotted alongside trend lines and bands for comprehensive trend analysis.
7. Bands and Trend Lines: The script plots upper, lower, and center bands based on standard deviation and moving averages, providing visual cues for potential support and resistance levels.
How to use it:
• Customization: Adjust the signal period, lookback range, RSI length, and ADX settings to fit your trading preferences.
• Interpretation: Green ART signal bars indicate bullish trends, while red bars indicate bearish trends. The trend line color changes from cyan to magenta based on the trend direction.
• Bands: Use the upper and lower bands as potential entry and exit points, with the center line acting as a trend confirmation.
This script offers a comprehensive approach to trend and momentum analysis, making it a valuable tool for traders seeking to enhance their trading strategies with advanced technical indicators.
!!! UPDATE:
New Feature: Smoothing in the ACI Function
The latest update to the script introduces smoothing to the Angle Calculation (ACI) function, enhancing the accuracy and clarity of trend detection. This smoothing technique reduces noise and provides a more consistent representation of trend angles, making it easier for traders to identify significant price movements and potential reversals.
Phát hành các Ghi chú
Changes made:1.) ACI Function:
Previous ACI function only considered the current value of x and its historical highest/lowest.
Updated ACI function includes a more comprehensive calculation with additional smoothing and weighted measures.
2.) General Structural Changes:
- Consolidated the trend calculation for more streamlined output.
- Modified plot colors and parameters to enhance visual clarity.
- Added input parameters for trend line width.
Update Description:
"This update includes an enhanced calculation methodology for the (ACI) function, resulting in more accurate and smoothened values. Additional changes include optimized trend analysis with adjustable parameters for trend line width and plot visual improvements. This provides better clarity and precision in the indicator's performance."
Phát hành các Ghi chú
Adaptive Relative Trend (ART) - Updated VersionThis update introduces significant improvements to the Adaptive Relative Trend (ART) indicator, enhancing its accuracy and adaptability to market conditions. Key changes include:
✅ Improved ACI Function: The angle calculation function (ACI) has been refined to utilize a double smoothing approach, providing a more responsive and precise trend angle measurement.
✅ Enhanced RSI & ADX Calculation: The integration of RSI and ADX now applies the updated ACI function, improving trend confirmation and reducing noise.
✅ Refined Trend & Signal Calculation: The ART signal calculation has been updated with a more adaptive formula that dynamically adjusts based on market conditions, enhancing reliability.
✅ Optimized Band & Offset Logic: The indicator now includes a revised smoothing and deviation calculation, resulting in better trend zone delineation and improved signal clarity.
These updates ensure a more accurate and responsive trend-following tool, making ART even more effective for traders looking to identify market direction with confidence. 🚀
#TechnicalAnalysis #TradingIndicator #TrendDetection
Phát hành các Ghi chú
The Adaptive Relative Trend (ART) has been updated to improve its accuracy, responsiveness, and visual clarity. This new version refines the calculations for the Angle Calculation Function (ACI), enhances the smoothing mechanism, and introduces a more intuitive visualization of the trend and bands. The updated ART indicator remains a powerful tool for identifying trends, momentum shifts, and potential reversals in the market.Key Changes and Improvements:
Refined Angle Calculation Function (ACI):
The ACI function has been simplified and optimized for better performance.
Instead of using HMA (Hull Moving Average) and RMA (Rolling Moving Average), the updated ACI now uses RSI-based normalization and RMS (Root Mean Square) for smoother and more reliable angle calculations.
This change reduces noise and improves the accuracy of trend detection.
Improved Signal Calculation:
The ART signal is now calculated using a combination of RSI, ADX, and price action, with enhanced smoothing via the ALMA (Arnaud Legoux Moving Average).
The updated formula for the ART signal is more responsive to market changes while maintaining stability.
Simplified Band Calculations:
The upper and lower bands are now calculated using a 1.62 standard deviation from the centerline, providing a clearer representation of volatility and potential support/resistance levels.
The centerline is calculated using the ALMA for smoother transitions.
Enhanced Visualization:
The trendline and ART signal are now plotted with a single color gradient, making it easier to interpret the trend direction.
The fill between the ART signal and trendline is color-coded to indicate bullish (teal) or bearish (pink) momentum.
The upper and lower bands are plotted with semi-transparent colors for better visibility.
Optimized Performance:
The script has been optimized for faster calculations and reduced resource usage, ensuring smooth performance even on lower-end devices.
Mã nguồn mở
Theo đúng tinh thần TradingView, tác giả của tập lệnh này đã công bố nó dưới dạng mã nguồn mở, để các nhà giao dịch có thể xem xét và xác minh chức năng. Chúc mừng tác giả! Mặc dù bạn có thể sử dụng miễn phí, hãy nhớ rằng việc công bố lại mã phải tuân theo Nội quy.
Thông báo miễn trừ trách nhiệm
Thông tin và các ấn phẩm này không nhằm mục đích, và không cấu thành, lời khuyên hoặc khuyến nghị về tài chính, đầu tư, giao dịch hay các loại khác do TradingView cung cấp hoặc xác nhận. Đọc thêm tại Điều khoản Sử dụng.