OPEN-SOURCE SCRIPT
Inverse Moving Average Weighted (IWMA)
Description:
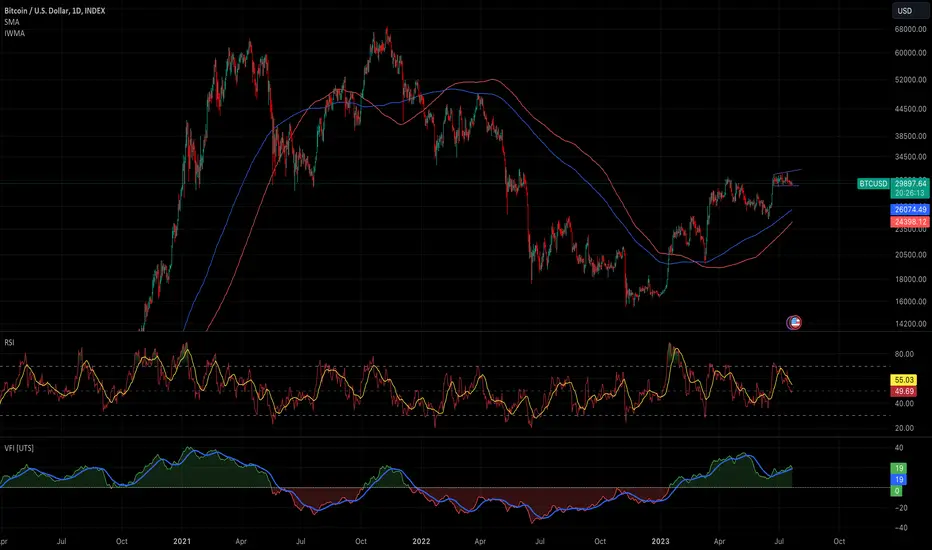
The Inverse Weighted Moving Average (IWMA) is a unique technical indicator that puts more emphasis on older price data compared to recent data. Unlike traditional moving averages that give more weight to recent data, the IWMA believes that older data points have a larger psychological impact on traders and therefore should be given more importance.
The IWMA is calculated by assigning weights to the price data points in a moving window, with the oldest data point given the highest weight and the most recent data point given the lowest weight. These weights are then used to calculate a weighted average, which forms the IWMA.
The IWMA can be used in the same way as other moving averages. When the price crosses above the IWMA, it may indicate a potential upward trend, signaling a good time to buy. Conversely, when the price crosses below the IWMA, it may indicate a potential downward trend, signaling a good time to sell.
The IWMA is a unique tool for traders who believe in the lasting impact of older price data. It provides a different perspective on price trends and can be a valuable addition to your trading toolkit.
Mã nguồn mở
Theo đúng tinh thần TradingView, tác giả của tập lệnh này đã công bố nó dưới dạng mã nguồn mở, để các nhà giao dịch có thể xem xét và xác minh chức năng. Chúc mừng tác giả! Mặc dù bạn có thể sử dụng miễn phí, hãy nhớ rằng việc công bố lại mã phải tuân theo Nội quy.
Thông báo miễn trừ trách nhiệm
Thông tin và các ấn phẩm này không nhằm mục đích, và không cấu thành, lời khuyên hoặc khuyến nghị về tài chính, đầu tư, giao dịch hay các loại khác do TradingView cung cấp hoặc xác nhận. Đọc thêm tại Điều khoản Sử dụng.