OPEN-SOURCE SCRIPT
Spread Chart
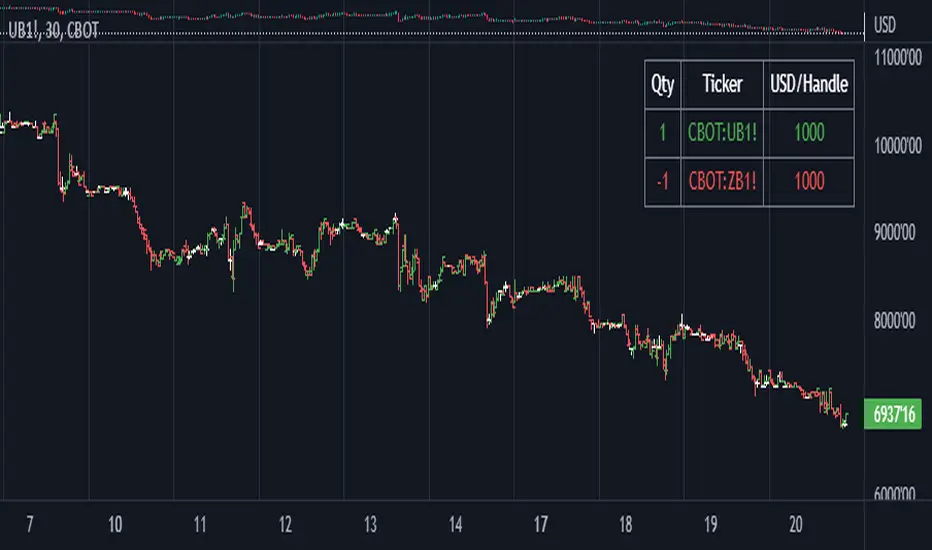
This script lets you chart a spread of a maximum of 3 tickers (one of them being the ticker in the main chart).
Y axis is the currency amount of the spread, that is calculated by this formula:
Y = PnL = quantity * price * handleValue
Y is calculated for each ticker specified, and the sum of Ys obtained is plotted.
this way it is possible to view the PnL of the spread directly.
It is necessary to specify the handle value (point value) in the script inputs (not for the main chart ticker).
A table summarizes the spread configuration, containing all inputs.
Mã nguồn mở
Theo tinh thần TradingView thực sự, tác giả của tập lệnh này đã xuất bản dưới dạng nguồn mở để các nhà giao dịch có thể hiểu và xác minh. Chúc mừng tác giả! Bạn có thể sử dụng miễn phí. Tuy nhiên, bạn cần sử dụng lại mã này theo Quy tắc nội bộ. Bạn có thể yêu thích nó để sử dụng nó trên biểu đồ.
Thông báo miễn trừ trách nhiệm
Thông tin và ấn phẩm không có nghĩa là và không cấu thành, tài chính, đầu tư, kinh doanh, hoặc các loại lời khuyên hoặc khuyến nghị khác được cung cấp hoặc xác nhận bởi TradingView. Đọc thêm trong Điều khoản sử dụng.