OPEN-SOURCE SCRIPT
Equity Curve
Cập nhật
An equity curve is a graphical representation of the change in the value of a trading account over a time period. The equity curve is a direct reflection of a trading strategy's effectiveness. A consistently upward-trending equity curve indicates a successful strategy, while a flat or declining curve may signal the need for adjustment.
This indicator takes traders daily account values as a comma separated list, and creates an equity curve and simple moving average of the equity curve. This serves as a mirror reflecting the outcome of past actions and decisions, guiding traders in fine-tuning their strategies, managing risk more effectively, and ultimately striving towards a consistently profitable trading journey.
New equity values should be added to the end of the current list. A space or no space after the comma has no effect.

Importance of the Equity Curve
Strategy Evaluation: The equity curve is a direct reflection of a trading strategy's effectiveness over time. A consistently upward-trending equity curve indicates a successful strategy, while a flat or declining curve may signal the need for adjustment.
Risk Management: Monitoring the equity curve helps traders to see the impact of their risk management practices. Sudden drops in equity could highlight instances of excessive risk-taking or inadequate stop-loss settings.
Performance Benchmarks: Comparing the equity curve against benchmarks or desired performance goals allows traders to assess if they are meeting, exceeding, or falling short of their trading objectives.
Psychology: Trading is as much about psychology as it is about strategy. A visual representation of one's equity curve helps maintain discipline, encouraging adherence to a trading plan during downturns and preventing overconfidence during upswings.
Having this data visually allows traders to see which category of trader they fall into.
Statistical Data
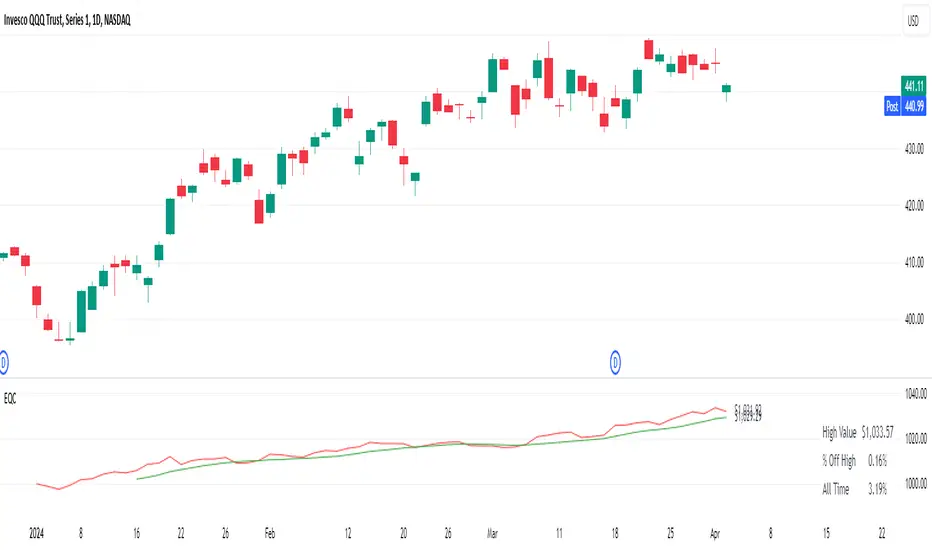
The indicator not only plots the equity curve and moving average, but includes the option to display the highest value reached by the equity curve, the percentage difference from the peak, and performance over selected periods (All Time, YTD, QTD, MTD, WTD).
Historical Analysis
The Equity Curve Indicator is not just a tool for real-time monitoring of trading performance; it also serves as a powerful instrument for conducting historical analysis. By analyzing the equity curve in conjunction with historical market conditions, traders can identify patterns or triggers that resulted in significant gains or losses.
For example, the chart below shows the equity curve overlaid on periods of net new highs / lows. The equity curve experienced declines while the market was showing net new lows or choppy periods (represented by a red or white background), while most of the equity gains were made while net new highs were present (green background).

This retrospective analysis helps in understanding how different market conditions impact trading strategies and performance.
Trading the Equity Curve
All trading strategies produce an equity curve that has winning and losing periods. In the example above, the trader could introduce a simple rule to lighten up on long positions or move to cash during periods of net new lows.
Another simple rule could be introduced to stop trading if the equity curve falls below the moving average, until favorable market conditions return again.
This indicator is intended to be used on the daily timeframe.
This indicator takes traders daily account values as a comma separated list, and creates an equity curve and simple moving average of the equity curve. This serves as a mirror reflecting the outcome of past actions and decisions, guiding traders in fine-tuning their strategies, managing risk more effectively, and ultimately striving towards a consistently profitable trading journey.
New equity values should be added to the end of the current list. A space or no space after the comma has no effect.
Importance of the Equity Curve
Strategy Evaluation: The equity curve is a direct reflection of a trading strategy's effectiveness over time. A consistently upward-trending equity curve indicates a successful strategy, while a flat or declining curve may signal the need for adjustment.
Risk Management: Monitoring the equity curve helps traders to see the impact of their risk management practices. Sudden drops in equity could highlight instances of excessive risk-taking or inadequate stop-loss settings.
Performance Benchmarks: Comparing the equity curve against benchmarks or desired performance goals allows traders to assess if they are meeting, exceeding, or falling short of their trading objectives.
Psychology: Trading is as much about psychology as it is about strategy. A visual representation of one's equity curve helps maintain discipline, encouraging adherence to a trading plan during downturns and preventing overconfidence during upswings.
Having this data visually allows traders to see which category of trader they fall into.
- Unprofitable
- Boom or Bust
- Profitable
Statistical Data
The indicator not only plots the equity curve and moving average, but includes the option to display the highest value reached by the equity curve, the percentage difference from the peak, and performance over selected periods (All Time, YTD, QTD, MTD, WTD).
Historical Analysis
The Equity Curve Indicator is not just a tool for real-time monitoring of trading performance; it also serves as a powerful instrument for conducting historical analysis. By analyzing the equity curve in conjunction with historical market conditions, traders can identify patterns or triggers that resulted in significant gains or losses.
For example, the chart below shows the equity curve overlaid on periods of net new highs / lows. The equity curve experienced declines while the market was showing net new lows or choppy periods (represented by a red or white background), while most of the equity gains were made while net new highs were present (green background).
This retrospective analysis helps in understanding how different market conditions impact trading strategies and performance.
Trading the Equity Curve
All trading strategies produce an equity curve that has winning and losing periods. In the example above, the trader could introduce a simple rule to lighten up on long positions or move to cash during periods of net new lows.
Another simple rule could be introduced to stop trading if the equity curve falls below the moving average, until favorable market conditions return again.
This indicator is intended to be used on the daily timeframe.
Phát hành các Ghi chú
updated line thicknessPhát hành các Ghi chú
Now links to the Portfolio Heat Indicator with the option to plot a line at what your portfolio value would be if all stops were hit. Portfolio Heat - https://www.tradingview.com/script/zn0dhdX7-Portfolio-Heat/
Mã nguồn mở
Theo tinh thần TradingView thực sự, tác giả của tập lệnh này đã xuất bản dưới dạng nguồn mở để các nhà giao dịch có thể hiểu và xác minh. Chúc mừng tác giả! Bạn có thể sử dụng miễn phí. Tuy nhiên, bạn cần sử dụng lại mã này theo Quy tắc nội bộ. Bạn có thể yêu thích nó để sử dụng nó trên biểu đồ.
Trusted Pine programmer. Send me a message for script development.
Thông báo miễn trừ trách nhiệm
Thông tin và ấn phẩm không có nghĩa là và không cấu thành, tài chính, đầu tư, kinh doanh, hoặc các loại lời khuyên hoặc khuyến nghị khác được cung cấp hoặc xác nhận bởi TradingView. Đọc thêm trong Điều khoản sử dụng.