OPEN-SOURCE SCRIPT
Cập nhật Good Signal Indicator
Description:
The Good Signal Indicator utilizes Exponential Moving Averages (EMA) across multiple timeframes to provide buy or sell signals based on the relative positioning of short-term and long-term EMAs.
Features:
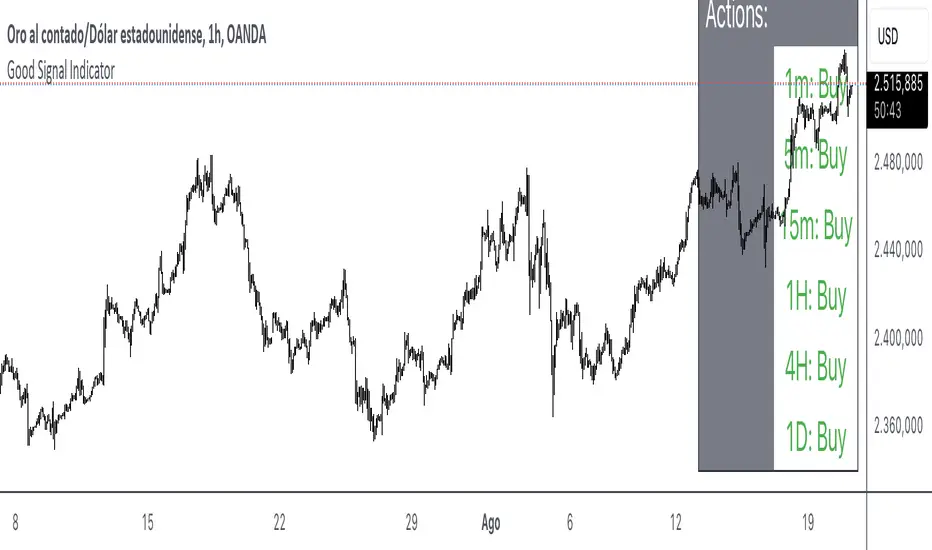
Multiple Timeframes: Includes EMAs for 1 minute, 5 minutes, 15 minutes, 1 hour, 4 hours, and 1 day.
Customizable Settings: Allows for the configuration of EMA lengths (20 and 50 periods).
Clear Signals: Displays buy, sell, or neutral signals on a table for each timeframe.
How It Works:
EMA Calculation: Computes the EMA values for specified lengths and timeframes.
Signal Generation: Determines buy and sell signals based on whether the current EMA is above or below the EMA from 30 bars ago.
Table Display: Presents the signals in a table at the bottom-right of the chart, showing whether to buy, sell, or hold for each timeframe.
Usage Instructions:
Apply the Indicator: Add the script to your TradingView chart.
Review Signals: Observe the table to understand the current trend for each timeframe.
Adjust Settings: Customize the EMA lengths if needed to fit your trading strategy.
Example Chart:
Ensure your chart is clean, showing only the indicator table without additional clutter. The table should clearly reflect the current buy, sell, or neutral status based on the EMA calculations.
Disclaimer: This indicator is a tool for analysis and should be used in conjunction with other indicators and market research. Always test with historical data before applying it to live trading.
The Good Signal Indicator utilizes Exponential Moving Averages (EMA) across multiple timeframes to provide buy or sell signals based on the relative positioning of short-term and long-term EMAs.
Features:
Multiple Timeframes: Includes EMAs for 1 minute, 5 minutes, 15 minutes, 1 hour, 4 hours, and 1 day.
Customizable Settings: Allows for the configuration of EMA lengths (20 and 50 periods).
Clear Signals: Displays buy, sell, or neutral signals on a table for each timeframe.
How It Works:
EMA Calculation: Computes the EMA values for specified lengths and timeframes.
Signal Generation: Determines buy and sell signals based on whether the current EMA is above or below the EMA from 30 bars ago.
Table Display: Presents the signals in a table at the bottom-right of the chart, showing whether to buy, sell, or hold for each timeframe.
Usage Instructions:
Apply the Indicator: Add the script to your TradingView chart.
Review Signals: Observe the table to understand the current trend for each timeframe.
Adjust Settings: Customize the EMA lengths if needed to fit your trading strategy.
Example Chart:
Ensure your chart is clean, showing only the indicator table without additional clutter. The table should clearly reflect the current buy, sell, or neutral status based on the EMA calculations.
Disclaimer: This indicator is a tool for analysis and should be used in conjunction with other indicators and market research. Always test with historical data before applying it to live trading.
Phát hành các Ghi chú
Description:The Good Signal Indicator utilizes Exponential Moving Averages (EMA) across multiple timeframes to provide buy or sell signals based on the relative positioning of short-term and long-term EMAs.
Features:
Multiple Timeframes: Includes EMAs for 1 minute, 5 minutes, 15 minutes, 1 hour, 4 hours, and 1 day.
Customizable Settings: Allows for the configuration of EMA lengths (20 and 50 periods).
Clear Signals: Displays buy, sell, or neutral signals on a table for each timeframe.
How It Works:
EMA Calculation: Computes the EMA values for specified lengths and timeframes.
Signal Generation: Determines buy and sell signals based on whether the current EMA is above or below the EMA from 30 bars ago.
Table Display: Presents the signals in a table at the bottom-right of the chart, showing whether to buy, sell, or hold for each timeframe.
Usage Instructions:
Apply the Indicator: Add the script to your TradingView chart.
Review Signals: Observe the table to understand the current trend for each timeframe.
Adjust Settings: Customize the EMA lengths if needed to fit your trading strategy.
Example Chart:
Ensure your chart is clean, showing only the indicator table without additional clutter. The table should clearly reflect the current buy, sell, or neutral status based on the EMA calculations.
Disclaimer: This indicator is a tool for analysis and should be used in conjunction with other indicators and market research. Always test with historical data before applying it to live trading.
Mã nguồn mở
Theo đúng tinh thần TradingView, tác giả của tập lệnh này đã công bố nó dưới dạng mã nguồn mở, để các nhà giao dịch có thể xem xét và xác minh chức năng. Chúc mừng tác giả! Mặc dù bạn có thể sử dụng miễn phí, hãy nhớ rằng việc công bố lại mã phải tuân theo Nội quy.
Thông báo miễn trừ trách nhiệm
Thông tin và các ấn phẩm này không nhằm mục đích, và không cấu thành, lời khuyên hoặc khuyến nghị về tài chính, đầu tư, giao dịch hay các loại khác do TradingView cung cấp hoặc xác nhận. Đọc thêm tại Điều khoản Sử dụng.