PINE LIBRARY
Cập nhật CommonMarkup
Library "CommonMarkup"
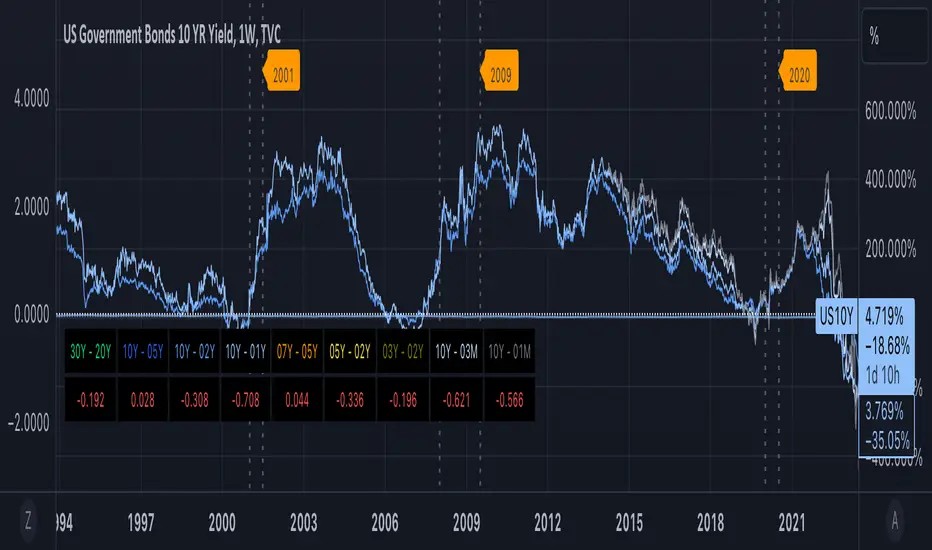
Provides functions for chart markup, such as indicating recession bands.
markRecessionBands(showBands, lineY, labelY)
Mark vertical bands and show recession band labels if argument showBands is true. Example "markRecessionBands(bar_index[0],3.0"
Parameters:
showBands: - show vertical recession bands when true. Functionally equiv to no op when false
lineY: - y-axis value for line positioning
labelY: - y-axis value for label positioning
return true - always answers the value of showBands
Phát hành các Ghi chú
Common markup lib v2. Changes as follows:- Added 2022 contraction over Q1 to Q2
- Updated time refs to be UTC+0
Phát hành các Ghi chú
Minor cosmetic rendering updatesPhát hành các Ghi chú
v4 - minor display and formatting updates for readabilityPhát hành các Ghi chú
v5Added control parameter for defining if 2 consecutive quarters of negative GDP is considered a recession
Updated:
markRecessionBands(showBands, twoQrtsOfNegativeGDPIsRecession, lineY, labelY)
Mark vertical bands and show recession band labels if argument showBands is true. Example "markRecessionBands(bar_index[0],3.0"
Parameters:
showBands: - show vertical recession bands when true. Functionally equiv to no op when false
twoQrtsOfNegativeGDPIsRecession: - if true, then periods with two consecutive quarters of negative GDP is considered a recession. Defaut is false.
lineY: - y-axis value for line positioning
labelY: - y-axis value for label positioning
return true - always answers the value of showBands
Phát hành các Ghi chú
v6Updated:
markRecessionBands(showBands, twoQrtsOfNegativeGDPIsRecession, labelY)
Mark vertical bands and show recession band labels if argument showBands is true. Example "markRecessionBands(bar_index[0],false3.0)"
Parameters:
showBands (bool): - show vertical recession bands when true. Functionally equiv to no op when false
twoQrtsOfNegativeGDPIsRecession (bool): - if true, then periods with two consecutive quarters of negative GDP are considered a recession. Defaut is false.
labelY (float): - y-axis value for label positioning
return true - always answers the value of showBands
Phát hành các Ghi chú
v7Updated:
- Resolved issue with private function for drawing recession bands scaling the y-axis excessively
Thư viện Pine
Theo đúng tinh thần TradingView, tác giả đã công bố mã Pine này như một thư viện mã nguồn mở để các lập trình viên Pine khác trong cộng đồng có thể tái sử dụng. Chúc mừng tác giả! Bạn có thể sử dụng thư viện này cho mục đích cá nhân hoặc trong các ấn phẩm mã nguồn mở khác, nhưng việc tái sử dụng mã này trong các ấn phẩm phải tuân theo Nội Quy.
Thông báo miễn trừ trách nhiệm
Thông tin và các ấn phẩm này không nhằm mục đích, và không cấu thành, lời khuyên hoặc khuyến nghị về tài chính, đầu tư, giao dịch hay các loại khác do TradingView cung cấp hoặc xác nhận. Đọc thêm tại Điều khoản Sử dụng.