OPEN-SOURCE SCRIPT
Anchored Monte Carlo Shuffled Projection [LuxAlgo]
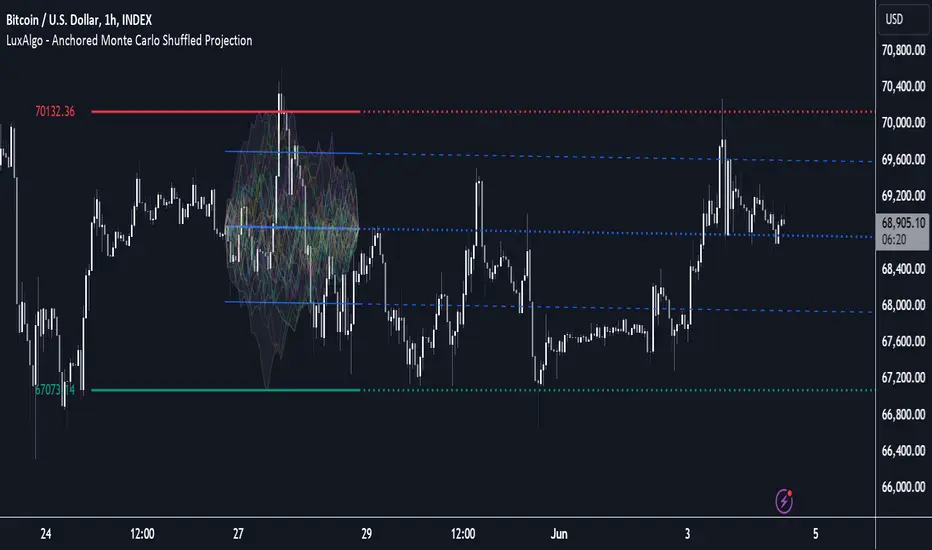
The Anchored Monte Carlo Shuffled Projection tool randomly simulates future price points based on historical bar movements made before a user-anchored point in time.
By anchoring our data and projections to a single point in time, users can better understand and reflect on how the price played out while taking into consideration our random simulations.
🔶 USAGE

After selecting the indicator to apply to the chart, you will be prompted to "Set the Anchor Point". Do so by clicking on the desired location on your chart, only time is used as the anchor point.
Note: To select a new anchor point when applied to the chart, click on the 'More' dropdown next to the indicator status bar (○○○), then select "Reset points...".
Alternate Method: You are also able to click and drag the vertical line that displays on the anchor point bar when the indicator is highlighted.

By randomly simulating bar movements, a range is developed of potential price action which could be utilized to locate future price development as well as potential support/resistance levels.
Performing numerous simulations and taking the average at each step will converge toward the result highlighted by the "Average Line", and can point out where the price might develop, assuming the trend and amount of volatility persist.
This constraint will cause the simulations always to display an endpoint consistent with the current lookback's slope.
While this may be helpful to some traders, this indicator includes an option to produce a less biased range, as seen below:

🔶 DETAILS
The Anchored Monte Carlo Shuffled Projection tool creates simulations based on prices within a user-set lookback window originating at the specified anchor point. Simulations are done as follows:
This is the process for the Default calculation; for the 'Randomize Direction' calculation, when added onto the front for every other change, the value is inverted, creating the randomized endpoints for each simulation.
The script contains each simulation's data for that bar, with a maximum of 1000 simulations.
To get a glimpse behind the scenes, each simulation (up to 99) can be viewed using the 'Visualize Simulations' Options, as seen below.

Because the script holds the full simulation data, the script can also calculate this data, such as standard deviations.
In this script the Standard deviation lines are the average of all standard deviations across the vertical data groups, this provides a singular value that can be displayed a distance away from the simulation center line.

🔶 SETTINGS
🔹Standard Deviations
🔹Style
By anchoring our data and projections to a single point in time, users can better understand and reflect on how the price played out while taking into consideration our random simulations.
🔶 USAGE
After selecting the indicator to apply to the chart, you will be prompted to "Set the Anchor Point". Do so by clicking on the desired location on your chart, only time is used as the anchor point.
Note: To select a new anchor point when applied to the chart, click on the 'More' dropdown next to the indicator status bar (○○○), then select "Reset points...".
Alternate Method: You are also able to click and drag the vertical line that displays on the anchor point bar when the indicator is highlighted.
By randomly simulating bar movements, a range is developed of potential price action which could be utilized to locate future price development as well as potential support/resistance levels.
Performing numerous simulations and taking the average at each step will converge toward the result highlighted by the "Average Line", and can point out where the price might develop, assuming the trend and amount of volatility persist.
This constraint will cause the simulations always to display an endpoint consistent with the current lookback's slope.
While this may be helpful to some traders, this indicator includes an option to produce a less biased range, as seen below:
🔶 DETAILS
The Anchored Monte Carlo Shuffled Projection tool creates simulations based on prices within a user-set lookback window originating at the specified anchor point. Simulations are done as follows:
- Collect each bar's price changes in the user-set window.
- Randomize the order of each change in the window.
- Project the cumulative sum of the shuffled changes from the current closing price.
- Collect data on each point along the way.
This is the process for the Default calculation; for the 'Randomize Direction' calculation, when added onto the front for every other change, the value is inverted, creating the randomized endpoints for each simulation.
The script contains each simulation's data for that bar, with a maximum of 1000 simulations.
To get a glimpse behind the scenes, each simulation (up to 99) can be viewed using the 'Visualize Simulations' Options, as seen below.
Because the script holds the full simulation data, the script can also calculate this data, such as standard deviations.
In this script the Standard deviation lines are the average of all standard deviations across the vertical data groups, this provides a singular value that can be displayed a distance away from the simulation center line.
🔶 SETTINGS
- Lookback: Sets the number of Bars to include in calculations.
- Simulation Count: Sets the number of randomized simulations to calculate. (Max 1000)
- Randomize Direction: See Details Above. Creates a more 'Normalized' Distribution
- Visualize Simulations: See Details Above. Turns on Visualizations, and colors are randomly generated. Visualized max does not cap the calculated max. If 1000 simulations are used, the data will be from 1000 simulations, however, only the last 99 simulations will be visualized.
🔹Standard Deviations
- Standard Deviation Multiplier: Sets the multiplier to use for the Standard Deviation distance away from the center line.
🔹Style
- Extend Lines: Extends the Simulated Value Lines into the future for further reference and analysis.
Mã nguồn mở
Theo tinh thần TradingView thực sự, tác giả của tập lệnh này đã xuất bản dưới dạng nguồn mở để các nhà giao dịch có thể hiểu và xác minh. Chúc mừng tác giả! Bạn có thể sử dụng miễn phí. Tuy nhiên, bạn cần sử dụng lại mã này theo Quy tắc nội bộ. Bạn có thể yêu thích nó để sử dụng nó trên biểu đồ.
Get access to our exclusive tools: luxalgo.com
Join our 150k+ community: discord.gg/lux
All content provided by LuxAlgo is for informational & educational purposes only. Past performance does not guarantee future results.
Join our 150k+ community: discord.gg/lux
All content provided by LuxAlgo is for informational & educational purposes only. Past performance does not guarantee future results.
Thông báo miễn trừ trách nhiệm
Thông tin và ấn phẩm không có nghĩa là và không cấu thành, tài chính, đầu tư, kinh doanh, hoặc các loại lời khuyên hoặc khuyến nghị khác được cung cấp hoặc xác nhận bởi TradingView. Đọc thêm trong Điều khoản sử dụng.