OPEN-SOURCE SCRIPT
Catastrophe Distance
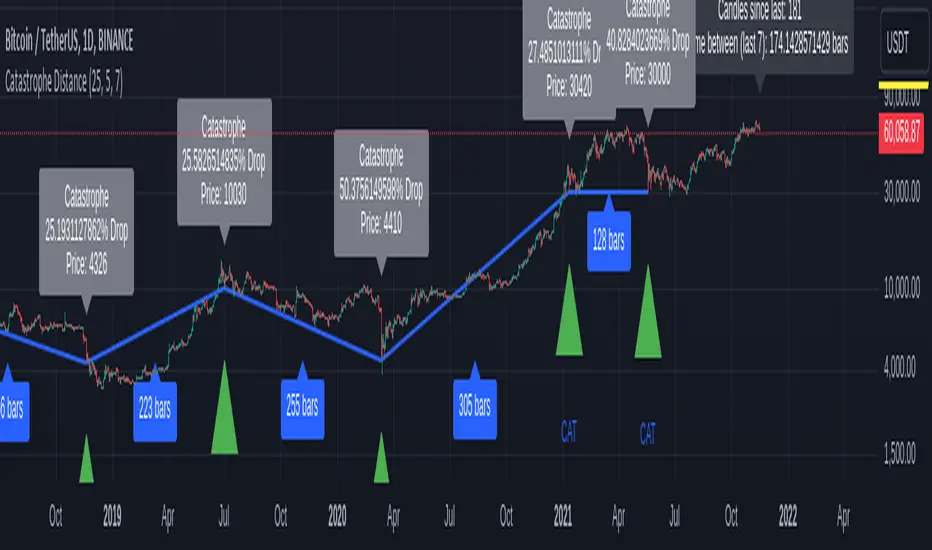
Catastrophe Distance is a tool to visually explore the time between catastrophic price moves.
Catastrophes are defined with 2 variables:
drawdown_threshold: the amount of percent the price has to fall
lookback_period = the amount of last candles in which drawdown_threshold was reached.
Drawdown_threshold per default is 25% and lookback_period is 5, meaning per default if price moves -25% in the last 5 candles you have a catastrophe.
Feel free to play around with this values to fit all the events you consider a catastrophe.
This indicator does not provide signals. It however implies caution if the time since the last catastrophe is higher then the average time between catastrophes (of last x catastrophes).
This is marked by the label over the current price showing the actual and average time since last catastrophe turning from green to black.
Given that the distance between catastrophes is somewhat cyclical:
Maybe now is a good time to start phishing for low limit orders and reduce leverage?
Mã nguồn mở
Theo đúng tinh thần TradingView, tác giả của tập lệnh này đã công bố nó dưới dạng mã nguồn mở, để các nhà giao dịch có thể xem xét và xác minh chức năng. Chúc mừng tác giả! Mặc dù bạn có thể sử dụng miễn phí, hãy nhớ rằng việc công bố lại mã phải tuân theo Nội quy.
Thông báo miễn trừ trách nhiệm
Thông tin và các ấn phẩm này không nhằm mục đích, và không cấu thành, lời khuyên hoặc khuyến nghị về tài chính, đầu tư, giao dịch hay các loại khác do TradingView cung cấp hoặc xác nhận. Đọc thêm tại Điều khoản Sử dụng.