OPEN-SOURCE SCRIPT
Historical US Bond Yield Curve
Cập nhật
Preface: I'm just the bartender serving today's freshly blended concoction; I'd like to send a massive THANK YOU to all the coders and PineWizards for the locally-sourced ingredients. I am simply a code editor, not a code author. Many thanks to these original authors!
Source 1 (Aug 8, 2019):

Source 2 (Aug 11, 2019):

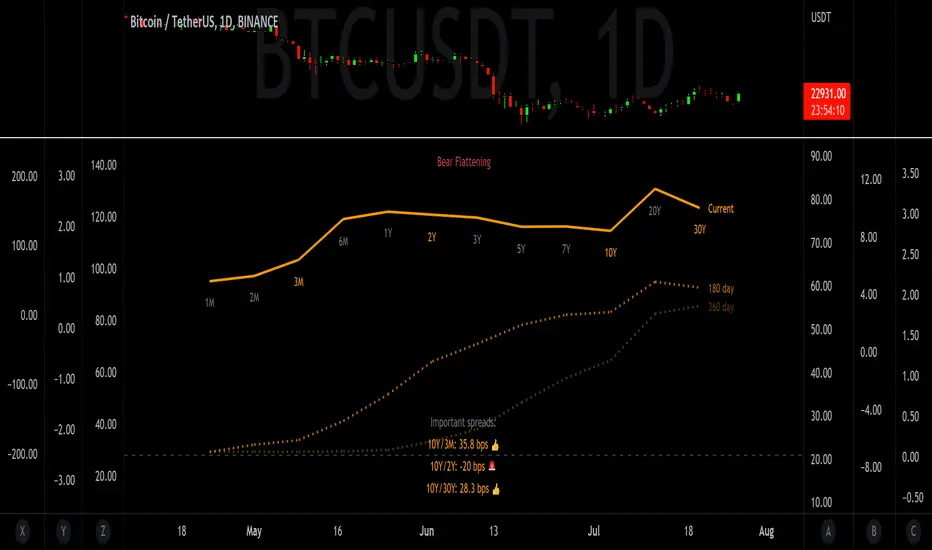
About the Indicator: The term yield curve refers to the yields of U.S. treasury bills, notes, and bonds in order from shortest to longest maturity date. The yield curve describes the shapes of the term structures of interest rates and their respective terms to maturity in years. The slope of the yield curve tells us how the bond market expects short-term interest rates to move in the future based on bond traders' expectations about economic activity and inflation. The best use of the yield curve is to get a sense of the economy's direction rather than to try to make an exact prediction. This indicator plots the U.S. yield curve as maturity (x-axis/time) vs yield (y-axis/price) in addition to historical yield curves and advanced data tickers. The visual array of historical yield curves helps investors visualize shifts in the yield curve that are useful when identifying & forecasting economic conditions. The bond market can help predict the direction of the economy which can be useful in crafting your investment strategy. An inverted 10y/2y yield curve for durations longer than 5 consecutive trading days signals an almost certain recession on the horizon. An inversion happens when short-term bonds pay better than longer-term bonds. There is Federal Reserve Board data that suggests the 10y3m may be a better predictor of recessions.
Features: Advanced dual data ticker that performs curve & important spread analysis, plus additional hover info. Advanced yield curve data labels with additional hover info. Customizable historical curves and color theme.
‼ IMPORTANT: Hover over labels/tables for advanced information. Chart asset and timeframe may affect the yield curve results; I have found consistently accurate results using
 BTCUSDT on 1d timeframe. Historical curve lookbacks will have an effect on whether the curve analysis says the curve is bull/bear steepening/flattening, so please use appropriate lookbacks.
⚠ DISCLAIMER: Not financial advice. Not a trading system. DYOR. I am not affiliated with the original authors, TradingView, Binance, or the Federal Reserve Board.
About the Editor: I am a former FINRA Registered Representative, inventor/patent holder, futures trader, and hobby PineScripter.
Source 1 (Aug 8, 2019):
Source 2 (Aug 11, 2019):
About the Indicator: The term yield curve refers to the yields of U.S. treasury bills, notes, and bonds in order from shortest to longest maturity date. The yield curve describes the shapes of the term structures of interest rates and their respective terms to maturity in years. The slope of the yield curve tells us how the bond market expects short-term interest rates to move in the future based on bond traders' expectations about economic activity and inflation. The best use of the yield curve is to get a sense of the economy's direction rather than to try to make an exact prediction. This indicator plots the U.S. yield curve as maturity (x-axis/time) vs yield (y-axis/price) in addition to historical yield curves and advanced data tickers. The visual array of historical yield curves helps investors visualize shifts in the yield curve that are useful when identifying & forecasting economic conditions. The bond market can help predict the direction of the economy which can be useful in crafting your investment strategy. An inverted 10y/2y yield curve for durations longer than 5 consecutive trading days signals an almost certain recession on the horizon. An inversion happens when short-term bonds pay better than longer-term bonds. There is Federal Reserve Board data that suggests the 10y3m may be a better predictor of recessions.
Features: Advanced dual data ticker that performs curve & important spread analysis, plus additional hover info. Advanced yield curve data labels with additional hover info. Customizable historical curves and color theme.
‼ IMPORTANT: Hover over labels/tables for advanced information. Chart asset and timeframe may affect the yield curve results; I have found consistently accurate results using
⚠ DISCLAIMER: Not financial advice. Not a trading system. DYOR. I am not affiliated with the original authors, TradingView, Binance, or the Federal Reserve Board.
About the Editor: I am a former FINRA Registered Representative, inventor/patent holder, futures trader, and hobby PineScripter.
Phát hành các Ghi chú
Critical update: Important Spread 10y/30y calculation.Other updates: 30y label color.
Mã nguồn mở
Theo tinh thần TradingView thực sự, tác giả của tập lệnh này đã xuất bản dưới dạng nguồn mở để các nhà giao dịch có thể hiểu và xác minh. Chúc mừng tác giả! Bạn có thể sử dụng miễn phí. Tuy nhiên, bạn cần sử dụng lại mã này theo Quy tắc nội bộ. Bạn có thể yêu thích nó để sử dụng nó trên biểu đồ.
Made w/ ❤ by @BarefootJoey ✌💗📈
Thông báo miễn trừ trách nhiệm
Thông tin và ấn phẩm không có nghĩa là và không cấu thành, tài chính, đầu tư, kinh doanh, hoặc các loại lời khuyên hoặc khuyến nghị khác được cung cấp hoặc xác nhận bởi TradingView. Đọc thêm trong Điều khoản sử dụng.