Biên tập viên chọnOPEN-SOURCE SCRIPT
LOWESS (Locally Weighted Scatterplot Smoothing) [ChartPrime]

LOWESS (Locally Weighted Scatterplot Smoothing) [ChartPrime]
⯁ OVERVIEW
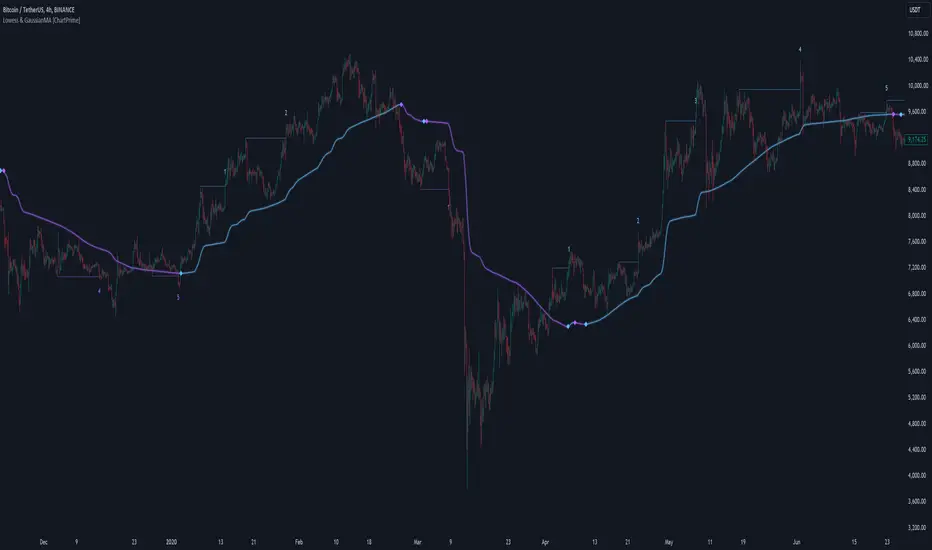
The LOWESS (Locally Weighted Scatterplot Smoothing) [ChartPrime] indicator is an advanced technical analysis tool that combines LOWESS smoothing with a Modified Adaptive Gaussian Moving Average. This indicator provides traders with a sophisticated method for trend analysis, pivot point identification, and breakout detection.
◆ KEY FEATURES
◆ FUNCTIONALITY DETAILS
⬥ LOWESS Calculation:
⬥ Modified Adaptive Gaussian Moving Average:
⬥ Pivot Point Detection and Visualization:
⬥ Breakout Tracking:
◆ USAGE
⯁ USER INPUTS
⯁ TECHNICAL NOTES
The LOWESS (Locally Weighted Scatterplot Smoothing) [ChartPrime] indicator offers traders a sophisticated tool for trend analysis and breakout detection. By combining advanced smoothing techniques with pivot point analysis, it provides a comprehensive view of market dynamics. The indicator's adaptability to different market conditions and its customizable nature make it suitable for various trading styles and timeframes.
⯁ OVERVIEW
The LOWESS (Locally Weighted Scatterplot Smoothing) [ChartPrime] indicator is an advanced technical analysis tool that combines LOWESS smoothing with a Modified Adaptive Gaussian Moving Average. This indicator provides traders with a sophisticated method for trend analysis, pivot point identification, and breakout detection.
◆ KEY FEATURES
- LOWESS Smoothing: Implements Locally Weighted Scatterplot Smoothing for trend analysis.
- Modified Adaptive Gaussian Moving Average: Incorporates a volatility-adapted Gaussian MA for enhanced trend detection.
- Pivot Point Identification: Detects and visualizes significant pivot highs and lows.
- Breakout Detection: Tracks and optionally displays the count of consecutive breakouts.
- Gaussian Scatterplot: Offers a unique visualization of price movements using randomly colored points.
- Customizable Parameters: Allows users to adjust calculation length, pivot detection, and visualization options.
◆ FUNCTIONALITY DETAILS
⬥ LOWESS Calculation:
- Utilizes a weighted local regression to smooth price data.
- Adapts to local trends, reducing noise while preserving important price movements.
⬥ Modified Adaptive Gaussian Moving Average:
- Combines Gaussian weighting with volatility adaptation using ATR and standard deviation.
- Smooths the Gaussian MA using LOWESS for enhanced trend visualization.
⬥ Pivot Point Detection and Visualization:
- Identifies pivot highs and lows using customizable left and right bar counts.
- Draws lines and labels to mark broke pivot points on the chart.
⬥ Breakout Tracking:
- Monitors price crossovers of pivot lines to detect breakouts.
- Optionally displays and updates the count of consecutive breakouts.
◆ USAGE
- Trend Analysis: Use the color and direction of the smoothed Gaussian MA line to identify overall trend direction.
- Breakout Trading: Monitor breakouts from pivot levels and their persistence using the breakout count feature.
- Volatility Assessment: The spread of the Gaussian scatterplot can provide insights into market volatility.
⯁ USER INPUTS
- Length: Sets the lookback period for LOWESS and Gaussian MA calculations (default: 30).
- Pivot Length: Determines the number of bars to the left for pivot calculation (default: 5).
- Count Breaks: Toggle to show the count of consecutive breakouts (default: false).
- Gaussian Scatterplot: Toggle to display the Gaussian MA as a scatterplot (default: true).
⯁ TECHNICAL NOTES
- Implements a custom LOWESS function for efficient local regression smoothing.
- Uses a modified Gaussian MA calculation that adapts to market volatility.
- Employs Pine Script's line and label drawing capabilities for clear pivot point visualization.
- Utilizes random color generation for the Gaussian scatterplot to enhance visual distinction between different time periods.
The LOWESS (Locally Weighted Scatterplot Smoothing) [ChartPrime] indicator offers traders a sophisticated tool for trend analysis and breakout detection. By combining advanced smoothing techniques with pivot point analysis, it provides a comprehensive view of market dynamics. The indicator's adaptability to different market conditions and its customizable nature make it suitable for various trading styles and timeframes.
Phát hành các Ghi chú
Patched functionality on stocksMã nguồn mở
Theo đúng tinh thần TradingView, tác giả của tập lệnh này đã công bố nó dưới dạng mã nguồn mở, để các nhà giao dịch có thể xem xét và xác minh chức năng. Chúc mừng tác giả! Mặc dù bạn có thể sử dụng miễn phí, hãy nhớ rằng việc công bố lại mã phải tuân theo Nội quy.
Thông báo miễn trừ trách nhiệm
Thông tin và các ấn phẩm này không nhằm mục đích, và không cấu thành, lời khuyên hoặc khuyến nghị về tài chính, đầu tư, giao dịch hay các loại khác do TradingView cung cấp hoặc xác nhận. Đọc thêm tại Điều khoản Sử dụng.
Mã nguồn mở
Theo đúng tinh thần TradingView, tác giả của tập lệnh này đã công bố nó dưới dạng mã nguồn mở, để các nhà giao dịch có thể xem xét và xác minh chức năng. Chúc mừng tác giả! Mặc dù bạn có thể sử dụng miễn phí, hãy nhớ rằng việc công bố lại mã phải tuân theo Nội quy.
Thông báo miễn trừ trách nhiệm
Thông tin và các ấn phẩm này không nhằm mục đích, và không cấu thành, lời khuyên hoặc khuyến nghị về tài chính, đầu tư, giao dịch hay các loại khác do TradingView cung cấp hoặc xác nhận. Đọc thêm tại Điều khoản Sử dụng.