OPEN-SOURCE SCRIPT
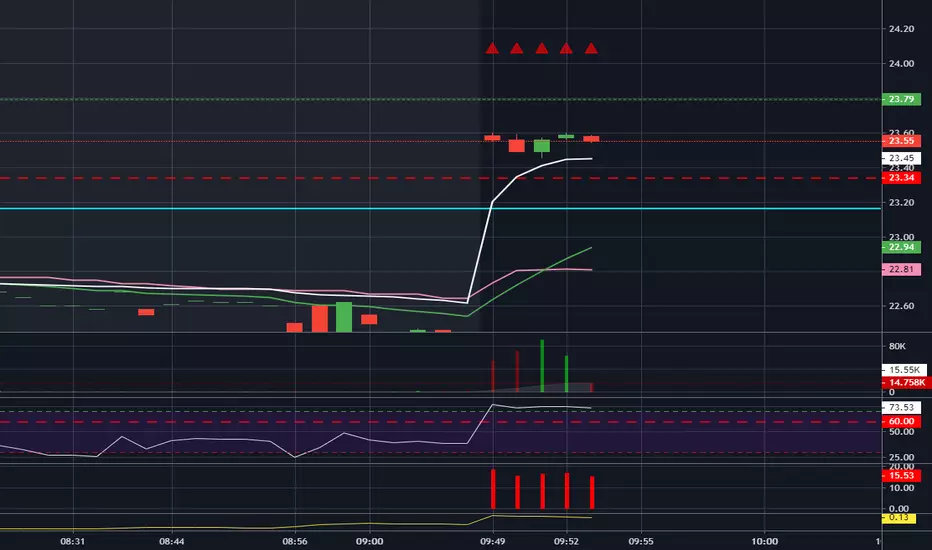
RSI Go long

Giving all credit to celena at WarriorTrading for the idea behind this script.
The script is pretty basic and self-explanatory. We will use certain RSI levels both on 5min and 1min to determine the strength/momentum of a stock.
The idea is to monitor 5m and 1m timeframes at once. if the RSI starts to test the initial level, we will see a plot on the graph ( default color is orange ). If we reach our target level and above, bar colors will change to default color green. If this happens in both 1min and 5 min timeframe it is an indicator of the strength of the stock. This indicator coupled with our own strategy helps us reinforce the idea for long entries.
Mã nguồn mở
Theo đúng tinh thần TradingView, tác giả của tập lệnh này đã công bố nó dưới dạng mã nguồn mở, để các nhà giao dịch có thể xem xét và xác minh chức năng. Chúc mừng tác giả! Mặc dù bạn có thể sử dụng miễn phí, hãy nhớ rằng việc công bố lại mã phải tuân theo Nội quy.
Trying to figure out trading, one chart at a time.
Just throwing away stupid trading ideas, these are not buy/sell alerts so please do your own due diligence.
Just throwing away stupid trading ideas, these are not buy/sell alerts so please do your own due diligence.
Thông báo miễn trừ trách nhiệm
Thông tin và các ấn phẩm này không nhằm mục đích, và không cấu thành, lời khuyên hoặc khuyến nghị về tài chính, đầu tư, giao dịch hay các loại khác do TradingView cung cấp hoặc xác nhận. Đọc thêm tại Điều khoản Sử dụng.