OPEN-SOURCE SCRIPT
Cập nhật Candle Percentage Change
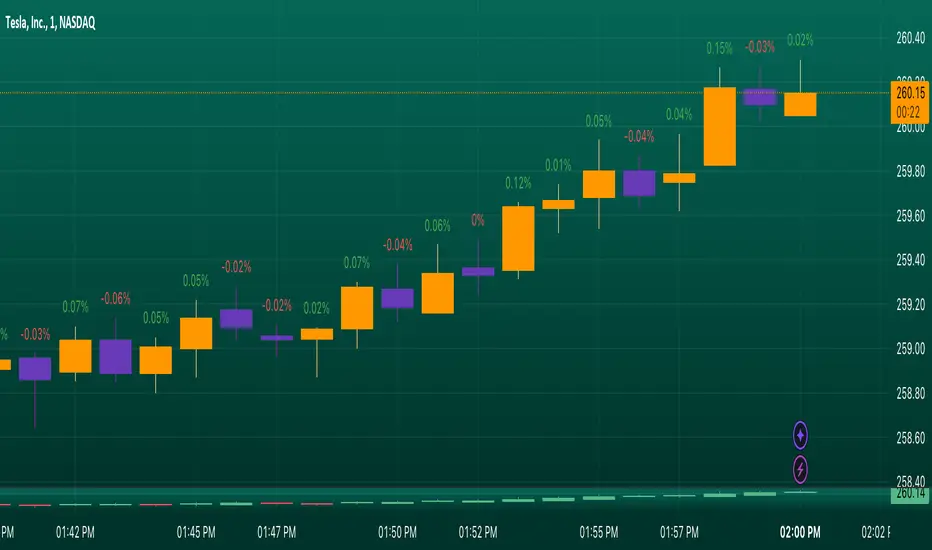
ndicator Setup: The script creates an indicator that overlays on the price chart.
Percentage Calculation: It calculates the percentage change between the current and previous candle closes.
Percentage Calculation: It calculates the percentage change between the current and previous candle closes.
Phát hành các Ghi chú
Key Features:Percentage Change Calculation:
The script calculates the percentage change between the closing price of the current candle and the previous candle.
The text color of the percentage change is determined based on the direction of the candle:
Green for bullish candles (close > open).
Red for bearish candles (close < open).
Label Positioning:
The percentage change label is positioned slightly above the high of each candle to ensure visibility and avoid overlap with the candle body.
The label uses the syminfo.mintick variable to maintain appropriate spacing based on the instrument's tick size.
Label Creation:
A new label is created for each candle, displaying the calculated percentage change as text.
The label has a transparent background for a cleaner appearance on the chart.
Usage:
This indicator can be added to any price chart in TradingView. It allows traders to assess price movements quickly, identify trends, and make informed trading decisions based on recent price changes.
Example of Use:
A trader looking at a candlestick chart can easily spot how much the price has changed between each candle. For instance, a label showing "+2.35%" indicates a 2.35% increase from the previous close, while "-1.20%" indicates a 1.20% decrease.
This script is particularly useful for day traders, swing traders, and anyone interested in analyzing price action with a clear visual representation of percentage changes in the market.
Phát hành các Ghi chú
Indicator Setup: The script creates an indicator that overlays on the price chart.Percentage Calculation: It calculates the percentage change between the current and previous candle closes.
Key Features:
Percentage Change Calculation:
The script calculates the percentage change between the closing price of the current candle and the previous candle.
The text color of the percentage change is determined based on the direction of the candle:
Green for bullish candles (close > open).
Red for bearish candles (close < open).
Usage:
This indicator can be added to any price chart in TradingView. It allows traders to assess price movements quickly, identify trends, and make informed trading decisions based on recent price changes.
Example of Use:
A trader looking at a candlestick chart can easily spot how much the price has changed between each candle. For instance, a label showing "+2.35%" indicates a 2.35% increase from the previous close, while "-1.20%" indicates a 1.20% decrease.
This script is particularly useful for day traders, swing traders, and anyone interested in analyzing price action with a clear visual representation of percentage changes in the market.
Phát hành các Ghi chú
Label overlapping issues fixed.Phát hành các Ghi chú
Label position fixedMã nguồn mở
Theo đúng tinh thần TradingView, tác giả của tập lệnh này đã công bố nó dưới dạng mã nguồn mở, để các nhà giao dịch có thể xem xét và xác minh chức năng. Chúc mừng tác giả! Mặc dù bạn có thể sử dụng miễn phí, hãy nhớ rằng việc công bố lại mã phải tuân theo Nội quy.
Thông báo miễn trừ trách nhiệm
Thông tin và các ấn phẩm này không nhằm mục đích, và không cấu thành, lời khuyên hoặc khuyến nghị về tài chính, đầu tư, giao dịch hay các loại khác do TradingView cung cấp hoặc xác nhận. Đọc thêm tại Điều khoản Sử dụng.
Mã nguồn mở
Theo đúng tinh thần TradingView, tác giả của tập lệnh này đã công bố nó dưới dạng mã nguồn mở, để các nhà giao dịch có thể xem xét và xác minh chức năng. Chúc mừng tác giả! Mặc dù bạn có thể sử dụng miễn phí, hãy nhớ rằng việc công bố lại mã phải tuân theo Nội quy.
Thông báo miễn trừ trách nhiệm
Thông tin và các ấn phẩm này không nhằm mục đích, và không cấu thành, lời khuyên hoặc khuyến nghị về tài chính, đầu tư, giao dịch hay các loại khác do TradingView cung cấp hoặc xác nhận. Đọc thêm tại Điều khoản Sử dụng.