OPEN-SOURCE SCRIPT
Moving Average Convergence Divergence and Momentum
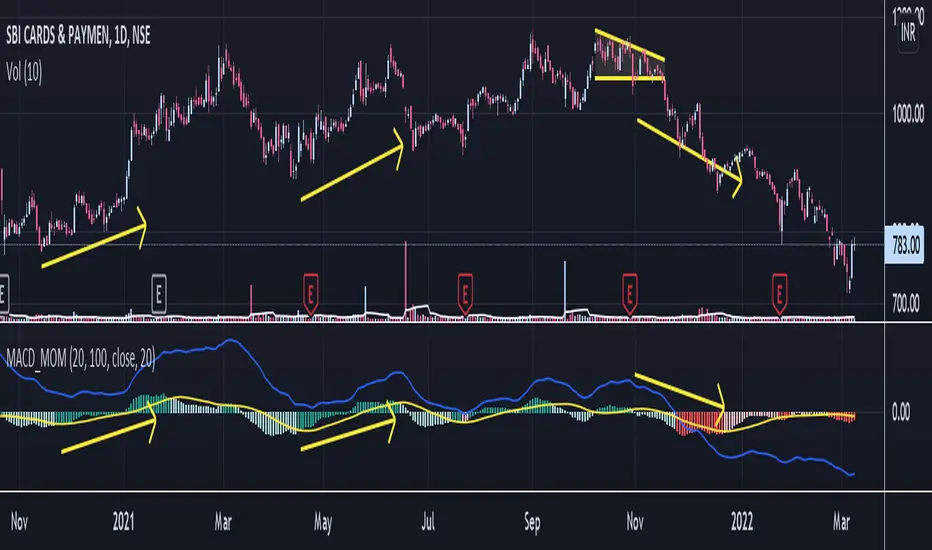
MACD line is difference between 20 EMA and 100 EMA which measures the Longterm trend. If MACD line is above Zero trend is positive. If MACD line is below zero trend is negative. Strategy is classic Buy in uptrend Sell in Downtrend.
To Improve the entry timing MACD histogram is used as Momentum. Histogram is the difference between MACD line and 20 EMA of MACD line. And Hist Momentum is the 20 SMA of histogram.
Advantage of histogram is Smoothness and better reliability than other momentum indicators like RSI which is volatile.
If MACD line is above zero = Trend is positive
and Histogram is above its SMA = Momentum is also positive.
Buy Signal.
If MACD line is above zero = Trend is positive
and Histogram is below its SMA = Trend is positive but Momentum is losing.
Look for Support levels or Break out of support level.
If MACD line is below zero = Trend is Negative
and Histogram is Below its SMA = Momentum is also Negative.
Sell Signal.
If MACD line is Below zero = Trend is Negative
and Histogram is above its SMA = Trend is negative but momentum is improving
Look for Resistance levels or Break out of resistance level.
Mã nguồn mở
Theo đúng tinh thần TradingView, tác giả của tập lệnh này đã công bố nó dưới dạng mã nguồn mở, để các nhà giao dịch có thể xem xét và xác minh chức năng. Chúc mừng tác giả! Mặc dù bạn có thể sử dụng miễn phí, hãy nhớ rằng việc công bố lại mã phải tuân theo Nội quy.
Thông báo miễn trừ trách nhiệm
Thông tin và các ấn phẩm này không nhằm mục đích, và không cấu thành, lời khuyên hoặc khuyến nghị về tài chính, đầu tư, giao dịch hay các loại khác do TradingView cung cấp hoặc xác nhận. Đọc thêm tại Điều khoản Sử dụng.