OPEN-SOURCE SCRIPT
Power Outage
The Power Outage indicator serves as the antithesis to the Power Trend, highlighting periods of extreme weakness or downtrends. Drawing inspiration from the Power Trend, the Power Outage framework was conceived by reversing the logic to highlight periods where being in cash or net short could be beneficial.
What Initiates a Power Outage?
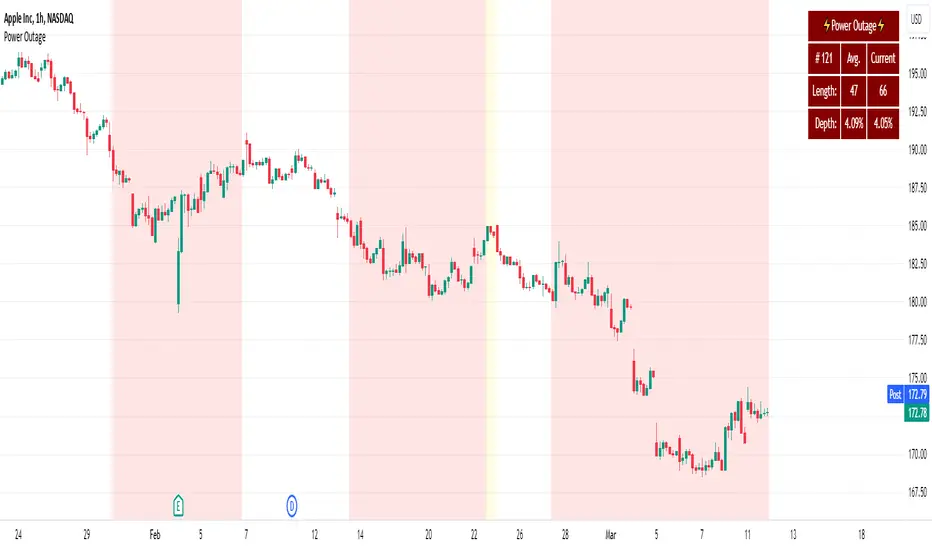
A Power Outage can be a caution sign for traders to tighten up risk management and encourage defensive strategies or the consideration of short positions. Not only does this indicator clearly identify a Power Outage by a shaded background or shape plotted on the chart, but it also records metrics for each previous Power Outage.
The number of Power Outages that have occurred, their average length, and average depth (from the first day's close when the Power Outage activates to the low of the Power Outage) are all displayed to help assess the condition of the current Power Outage.
What Ends a Power Outage?
A Power Outage ends when the 21-day EMA crosses above the 50-day SMA, or when the price closes 10% above the recent low and above the 50-day SMA.
This indicator is designed to be viewed on a daily time frame.
What Initiates a Power Outage?
- The high is below the 21-day EMA for at least 10 consecutive days.
- The 21-day EMA is below the 50-day SMA for a minimum of five days.
- The 50-day SMA is on a downward trajectory.
- The closing price is lower than the previous day's close.
A Power Outage can be a caution sign for traders to tighten up risk management and encourage defensive strategies or the consideration of short positions. Not only does this indicator clearly identify a Power Outage by a shaded background or shape plotted on the chart, but it also records metrics for each previous Power Outage.
The number of Power Outages that have occurred, their average length, and average depth (from the first day's close when the Power Outage activates to the low of the Power Outage) are all displayed to help assess the condition of the current Power Outage.
What Ends a Power Outage?
A Power Outage ends when the 21-day EMA crosses above the 50-day SMA, or when the price closes 10% above the recent low and above the 50-day SMA.
This indicator is designed to be viewed on a daily time frame.
Mã nguồn mở
Theo tinh thần TradingView thực sự, tác giả của tập lệnh này đã xuất bản dưới dạng nguồn mở để các nhà giao dịch có thể hiểu và xác minh. Chúc mừng tác giả! Bạn có thể sử dụng miễn phí. Tuy nhiên, bạn cần sử dụng lại mã này theo Quy tắc nội bộ. Bạn có thể yêu thích nó để sử dụng nó trên biểu đồ.
Trusted Pine programmer. Send me a message for script development.
Thông báo miễn trừ trách nhiệm
Thông tin và ấn phẩm không có nghĩa là và không cấu thành, tài chính, đầu tư, kinh doanh, hoặc các loại lời khuyên hoặc khuyến nghị khác được cung cấp hoặc xác nhận bởi TradingView. Đọc thêm trong Điều khoản sử dụng.